
Did you know that 70% of companies today have made a serious decision based on inaccurate financial data?
This may sound surprising, but if we consider that less than 25% of businesses are holistically data-driven, it makes perfect sense.
For marketing, sales, and customer service teams, inaccurate data isn’t always a dealbreaker, and gut feeling still counts. But for finance and accounting teams, it’s an absolute nightmare.
In this blog article, we are going to talk about the following (click the links to skip down):
- Challenges and limitations of financial software
- Why and how to integrate financial data in a BI tool
- Connecting accounting and other data sources to a BI tool
- As an example, we will use Dataddo to connect Exact Online to Power BI
- Visualizing, analyzing, and blending financial & non-financial data in Power BI
- Key takeaways: 9 steps to smarter financial dashboards
- Additional Power BI tips, tricks, and resources
At the end of the article, you will find a free, downloadable Power BI management dashboard template by The Reporting Agency—a business intelligence consulting agency specializing in Power BI and Power Apps solutions—as well as a bundle of resources to help you set it up.
Financial Software: Challenges and Limitations
 According to Dennis de Gier, the Reporting Agency’s Managing Consultant:
"Business owners often complain that finance managers don’t give them or other company decision-makers the insights they need."
One simple reason for this is that built-in reports from financial software typically require a license to view. So, if access is granted to all stakeholders, it’s expensive; otherwise, access is limited to the finance department or—in case of smaller companies—an external accountant.
Another reason is that, even if everyone did have access, the reports from financial software are static and don’t contain the historical data or trend analyses that management actually needs.
A third reason is that exporting the data from these tools and combining it with data from other tools is either too complex or too impractical. Indeed, a lot of finance teams spend more time manually importing data to Excel and creating reports than actually analyzing the data.
Of course, data in financial tools is usually well-organized, even if limited. But when reports are shared between teams and departments, data definitions get blurred, because each department has its own KPIs and interprets the data in a slightly different way. So, it’s not just that data is incomplete or inaccurate, it’s that there’s no company-wide policy for how to interpret it.
The result of the above is that there is no single source of truth or single method for analyzing data and making decisions.
Why and How to Integrate Financial Data in a BI Tool
Deriving profitable value from data is just as much about managing the data (integrating it, making sure it’s complete and accurate) as it is about interpreting it (having a governance policy with clear data definitions and KPIs, ensuring that stakeholders are properly informed).
Before data can be interpreted, it needs to be managed, and a major part of management is integration.
-min.jpg?width=2280&height=1510&name=Buy%20connectors_featured-1%20(1)-min.jpg)
In addition to financial software, your company probably has a CRM, a few marketing platforms, and a range of other data-generating tools. These tools don’t communicate with each other natively, but you need to connect the information they store to get a full understanding of company finances in the context of all other operations. You can do this in three ways:
Method One: Export/Import Data Manually
Exporting and importing CSV files from each system into your BI tool can be sufficient when you are working with data from just a few sources. But, sooner or later, the number of data sources you are working with will increase, and you’ll want to start doing more advanced blends and computations. At this point, manual data export/import will become so tedious and prone to human error that it will be unsustainable.
Once the manual way becomes unsustainable, you will then have two choices for how to proceed.
Method Two: Build Pipelines in-House
This method gives you more flexibility and full control over all integrations. But the cost of ownership is extremely high. Pipelines require a lot of manpower to build, and even more manpower to maintain because the APIs of online services are changing all the time. So, unless, your organization needs absolute control, the third method is most advisable.
Method Three: Use a Fully Managed SaaS Solution
For the majority of applications, the most practical method for integrating data is to use a managed, no-code ETL/ELT tool. Many such tools allow you to build pipelines in minutes, and don’t require any maintenance on the part of the user. Plus, they get the job done for a fraction of the cost of doing it in-house.
Dataddo is one such tool, and, below, we will show you how to use it to connect financial and other software to a BI tool. As examples, we will use Exact Online and Power BI, but the process would be similar with any other source and destination.
Connecting Exact Online (or Other Service) to Power BI
Before we start connecting tools, let us explain why we are using Exact Online and Power BI as examples.
Popular in the Benelux countries, Exact Online is a robust financial management tool, whose makers focus on developing their core software rather than a business intelligence solution. For this reason, its APIs are open, enabling connectivity with dedicated BI tools. It is therefore ideal for showcasing the importance of leveraging APIs to unlock the potential of financial data.
Popular just about everywhere, Power BI is a leading business intelligence tool. According to Gonnie Levy-Tuurenhout, Senior Power BI Consultant at The Reporting Agency:

"[Power BI] drastically reduces the time it takes to make reports compared to more traditional tools like Excel. This is thanks to its advanced visualization functionality and the fact that it enables so much automation."
In the video below, Marek Mica from Dataddo’s Solutions Team shows us in detail how to connect the two tools using Dataddo. To read about how to connect Exact Online to Power BI, see our documentation.
*This video clip was taken from a webinar on smarter financial dashboards for SMEs. See the full webinar here.
Building Better Dashboards (in Power BI)
There is so much you can do in Power BI, and the needs of each company are so specific that it’s impossible to lay out a one-size-fits-all approach. But here are examples of sophisticated and dynamic dashboards that will give you an idea of the kinds of elements that can be combined in a single report, plus some tips and tricks for using Power BI.
These are presented by Gonnie Levy-Tuurenhout, Senior Power BI Consultant at The Reporting Agency.
*Note: Much of the text you will see in the video clips below is Dutch, but the language of reports in Power BI depends on the language configurations of source systems (like Exact Online).
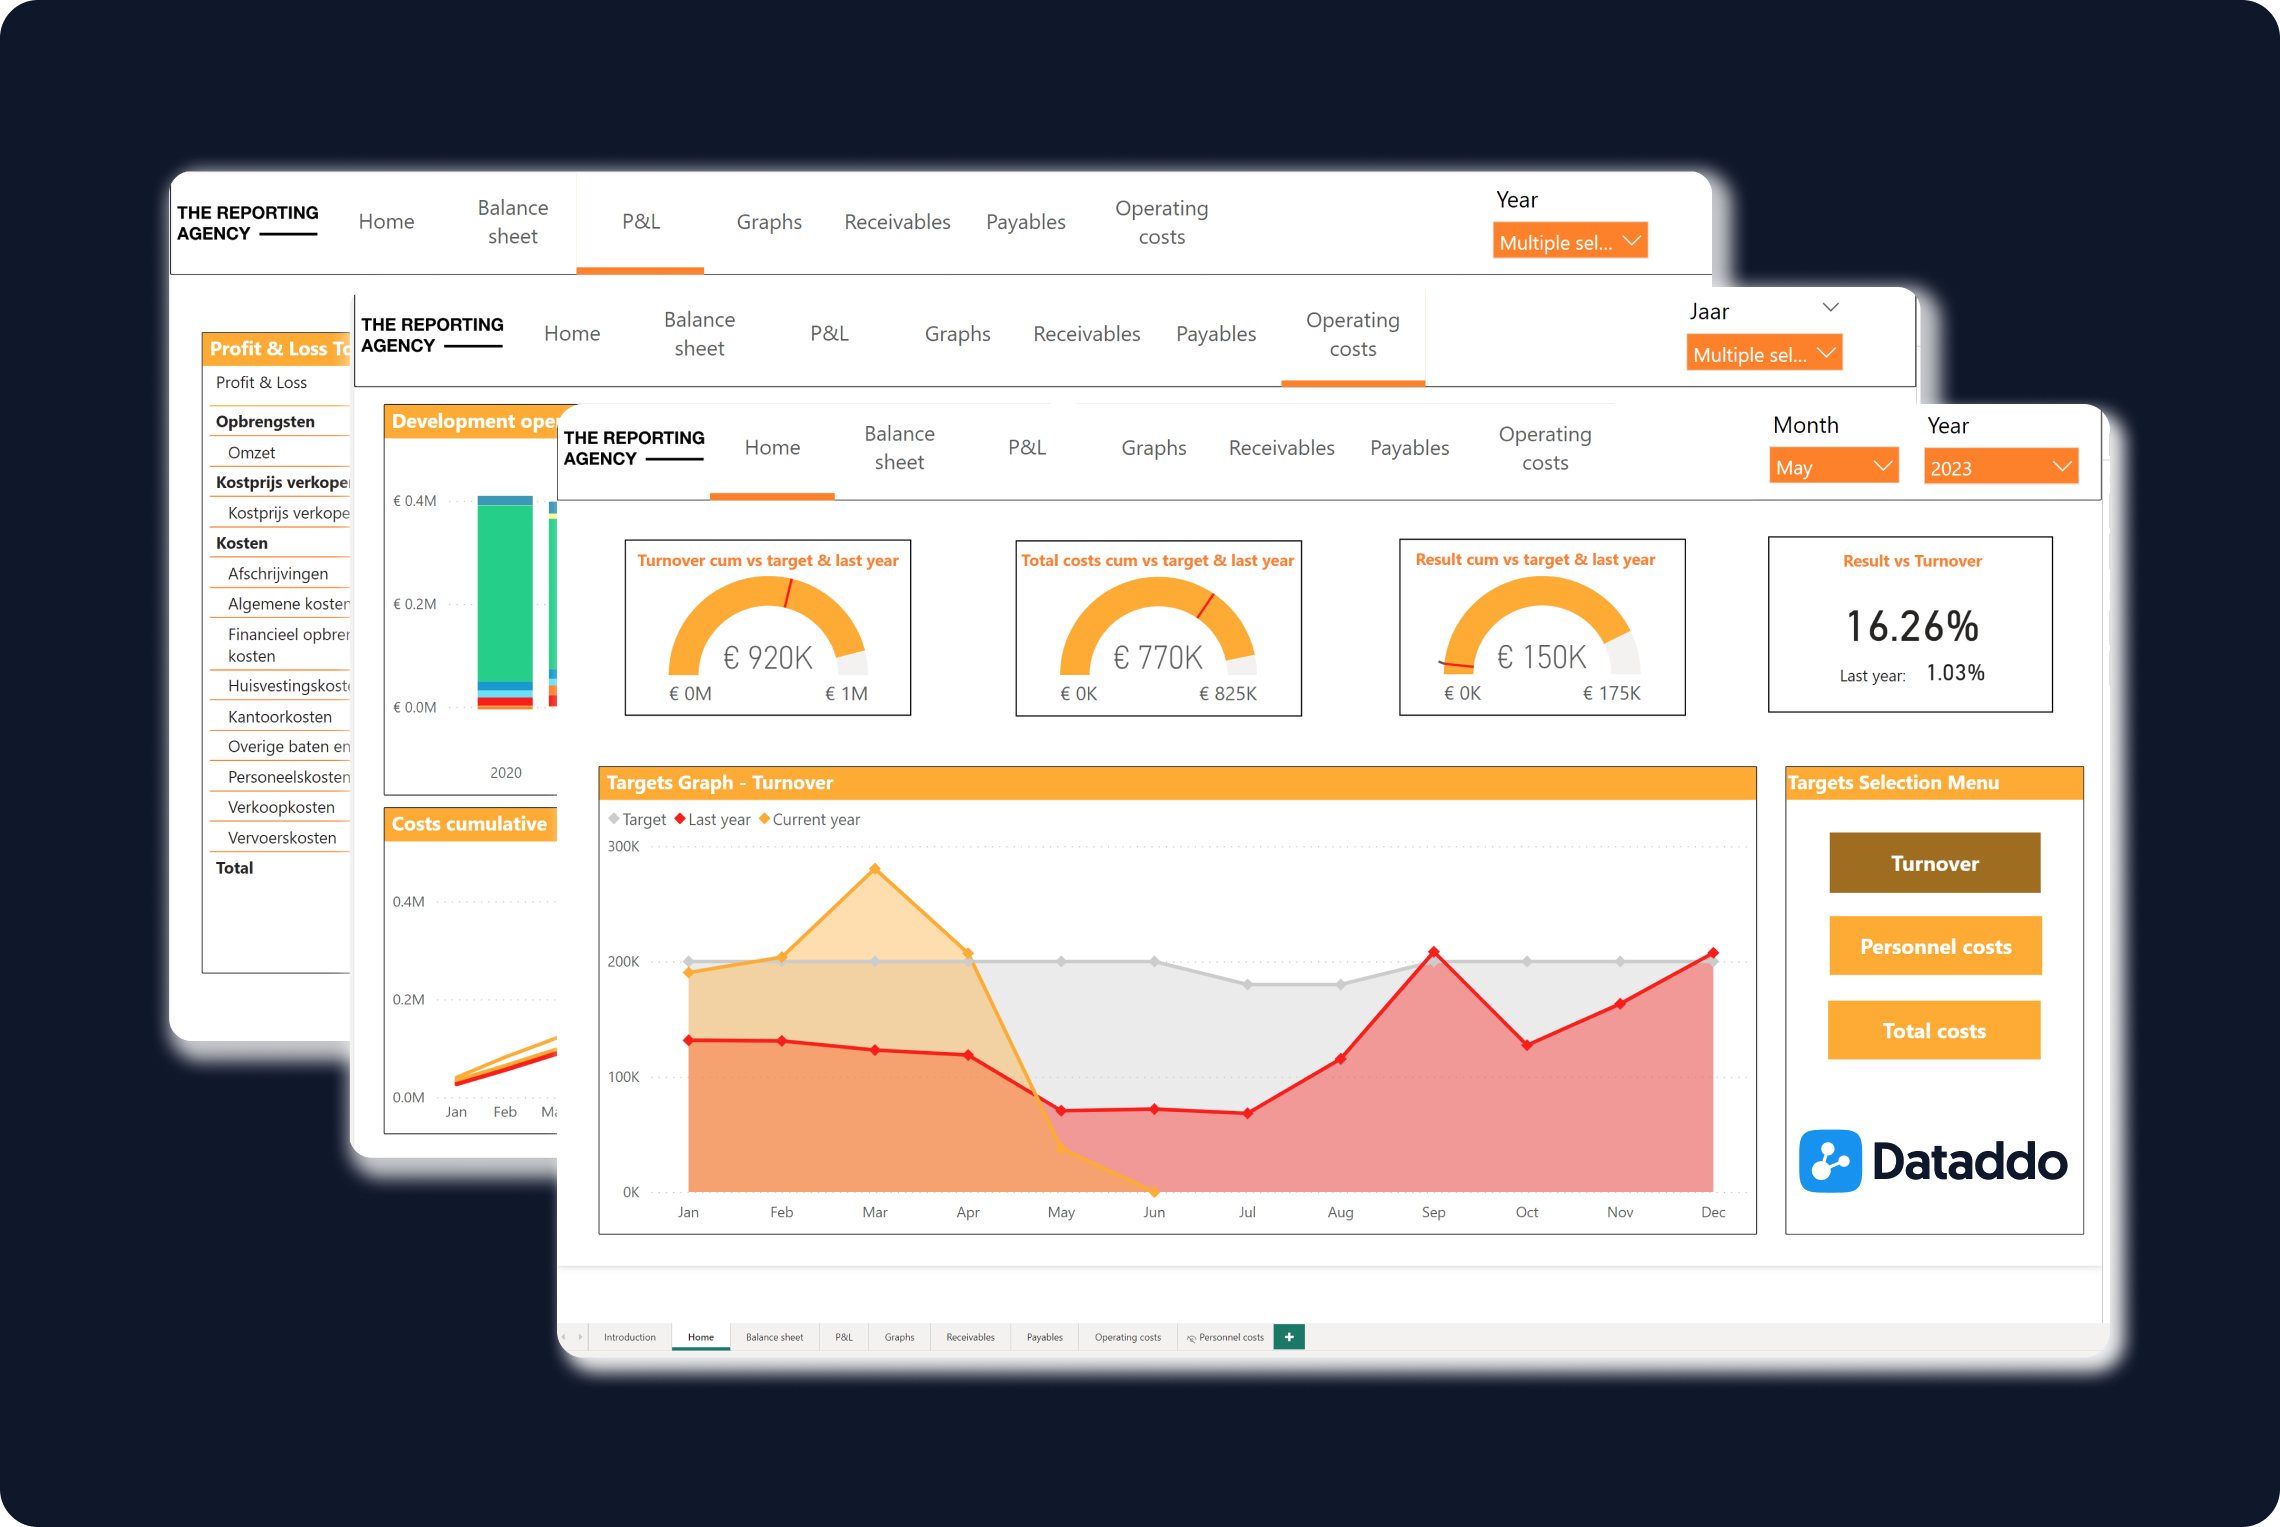
Report #1
This first report, which contains mock data, shows KPIs like turnover, costs, and results.
As you will see, Power BI’s features for filtering and toggling make the data much more navigable than it would be in Excel.
The report is downloadable as a template at the bottom of this article.
Report #2
Below is a production report for a project management company. It is hosted in The Reporting Agency’s online environment, where they develop and share dashboards with their customers.
The report illustrates how combination of multiple datasets can yield a comprehensive overview of business performance.
Report #3
This third report is for an agricultural business, and it combines data from four sources via an API link: a production system, a financial system, an HR system, and an Excel budget sheet.
This report is much larger than the previous two reports; it contains sections on finance, sales, HR, quality, and even a dashboard that assesses the impact of certain price increases on margins.
Key Takeaways: 9 Steps to Smarter Financial Dashboards
Managing Consultant of The Reporting Agency Dennis de Gier summarizes nine key takeaways we can use to start building smarter financial dashboards today:
-
Identify stakeholders: Determine who will use the dashboard and the type of information that will inform their decisions.
-
Standardize definitions: Every company, no matter how small, needs rules and procedures for how data should be defined and interpreted.
-
Defining KPIs: Know your goals and how to track them.
-
Data automation: To eliminate integration errors and shorten time to insights, automate the process of data extraction and transformation.
-
Decide whether to build dashboards internally or externally: In many cases, outsourcing dashboard management saves time, provides external expertise, and is ultimately more cost-effective.
-
Allocate time and resources: Effectively using data to make better financial decisions takes time and usually money. Resource planning is therefore a key part of project and expectation management.
-
Create dashboard mock-ups: First iterations of financial dashboards are rarely a slam dunk. On the contrary, the best ones have usually passed several times through a feedback loop. So, when creating a new report, get plenty of feedback from stakeholders to ensure it's user-friendly and effective.
-
Start simple: If you need complex dashboards, build them step by step. Many organizations bite off more than they can chew at first, then get stuck in the details before gleaning any profitable insights. Starting simple will keep the data manageable, and leave stakeholders asking for more.
-
Take action: Once you have a plan in place, act on it as soon as possible. The benefits of better decision-making and streamlined report creation will be worth it, especially if the reporting process is already eating up too much of your time!
Get Started Today with a Free Power BI Template
To get started, you can download a free Power BI template, plus a bundle of resources to help you set it up—all courtesy of The Reporting Agency. The resources include:
- A detailed tutorial video for how to configure Power BI to receive data
- A quickstart guide to supplement the tutorial video
- A mapping table
Submit the form below and we'll send you an email with links to the template.
Note: By submitting the form below, you agree that the information you provide will be shared with both Dataddo and The Reporting Agency.
*This blog article is based on a webinar by Dataddo and The Reporting Agency.
Additional Power BI Tips, Tricks, and Resources
Continue reading the Dataddo blog for more Power BI tips, tricks, and resources!
- Facebook Ads Dashboard Using Dataddo and Power BI
- Overcome Data Blending Limitations of Tableau, Looker, Power BI
- Mastering DAX Functions in Power BI
- Guide To M Code in Power BI: A Power Query Formula Language
- Guide to Slicers in Power BI: Create Better-Looking Reports
- How to Connect NetSuite to Power BI: ODBC vs. Dataddo
- How to Connect Google Sheets with Power BI: Direct vs. Dataddo
- How to Connect Stripe to Power BI: Direct vs. Dataddo
- How to Connect Sage Accounting to Power BI for FREE: Direct vs. Dataddo
- How to Connect Google Analytics to Power BI for FREE: Direct vs. Dataddo
- How to connect JSON with Power BI: Direct vs. Dataddo
- Connecting Xero to Power BI: Native or Third-Party Connector?
- How to Integrate Exact Online Data with Power BI (or any BI Tool)
|
Integrate All Your Data in Any BI Tool with Dataddo Just a few quick steps to get your data to your dashboard,
|


Comments