
Dashboarding tools like Tableau, Looker Studio, and Power BI are great for data visualization and offer some transformation capability via inbuilt functions. But these kinds of tools are unable to perform advanced data manipulations. Although they do offer data blending functionality, in practice, it's rather difficult to set up and debug.
Here is a workaround using Dataddo, which allows users to easily perform various joining operations (e.g. left join, right join, inner join) as well as data unions, without writing any code, before sending data to your dashboard.
This trick gives users much more visualization flexibility, and can work with any dashboarding app.
Want some dashboard tips & tricks?
- Learn how to work with multiple date ranges.
- Get 3 free dashboard templates for beginners.
- Find out how to track your Instagram follower count.
- Learn how to calculate weighted averages.
Getting Started
Start by creating a flow in the Dataddo platform.
Don't have a Dataddo account? Sign up for a free 14-day trial of the Dataddo platform!
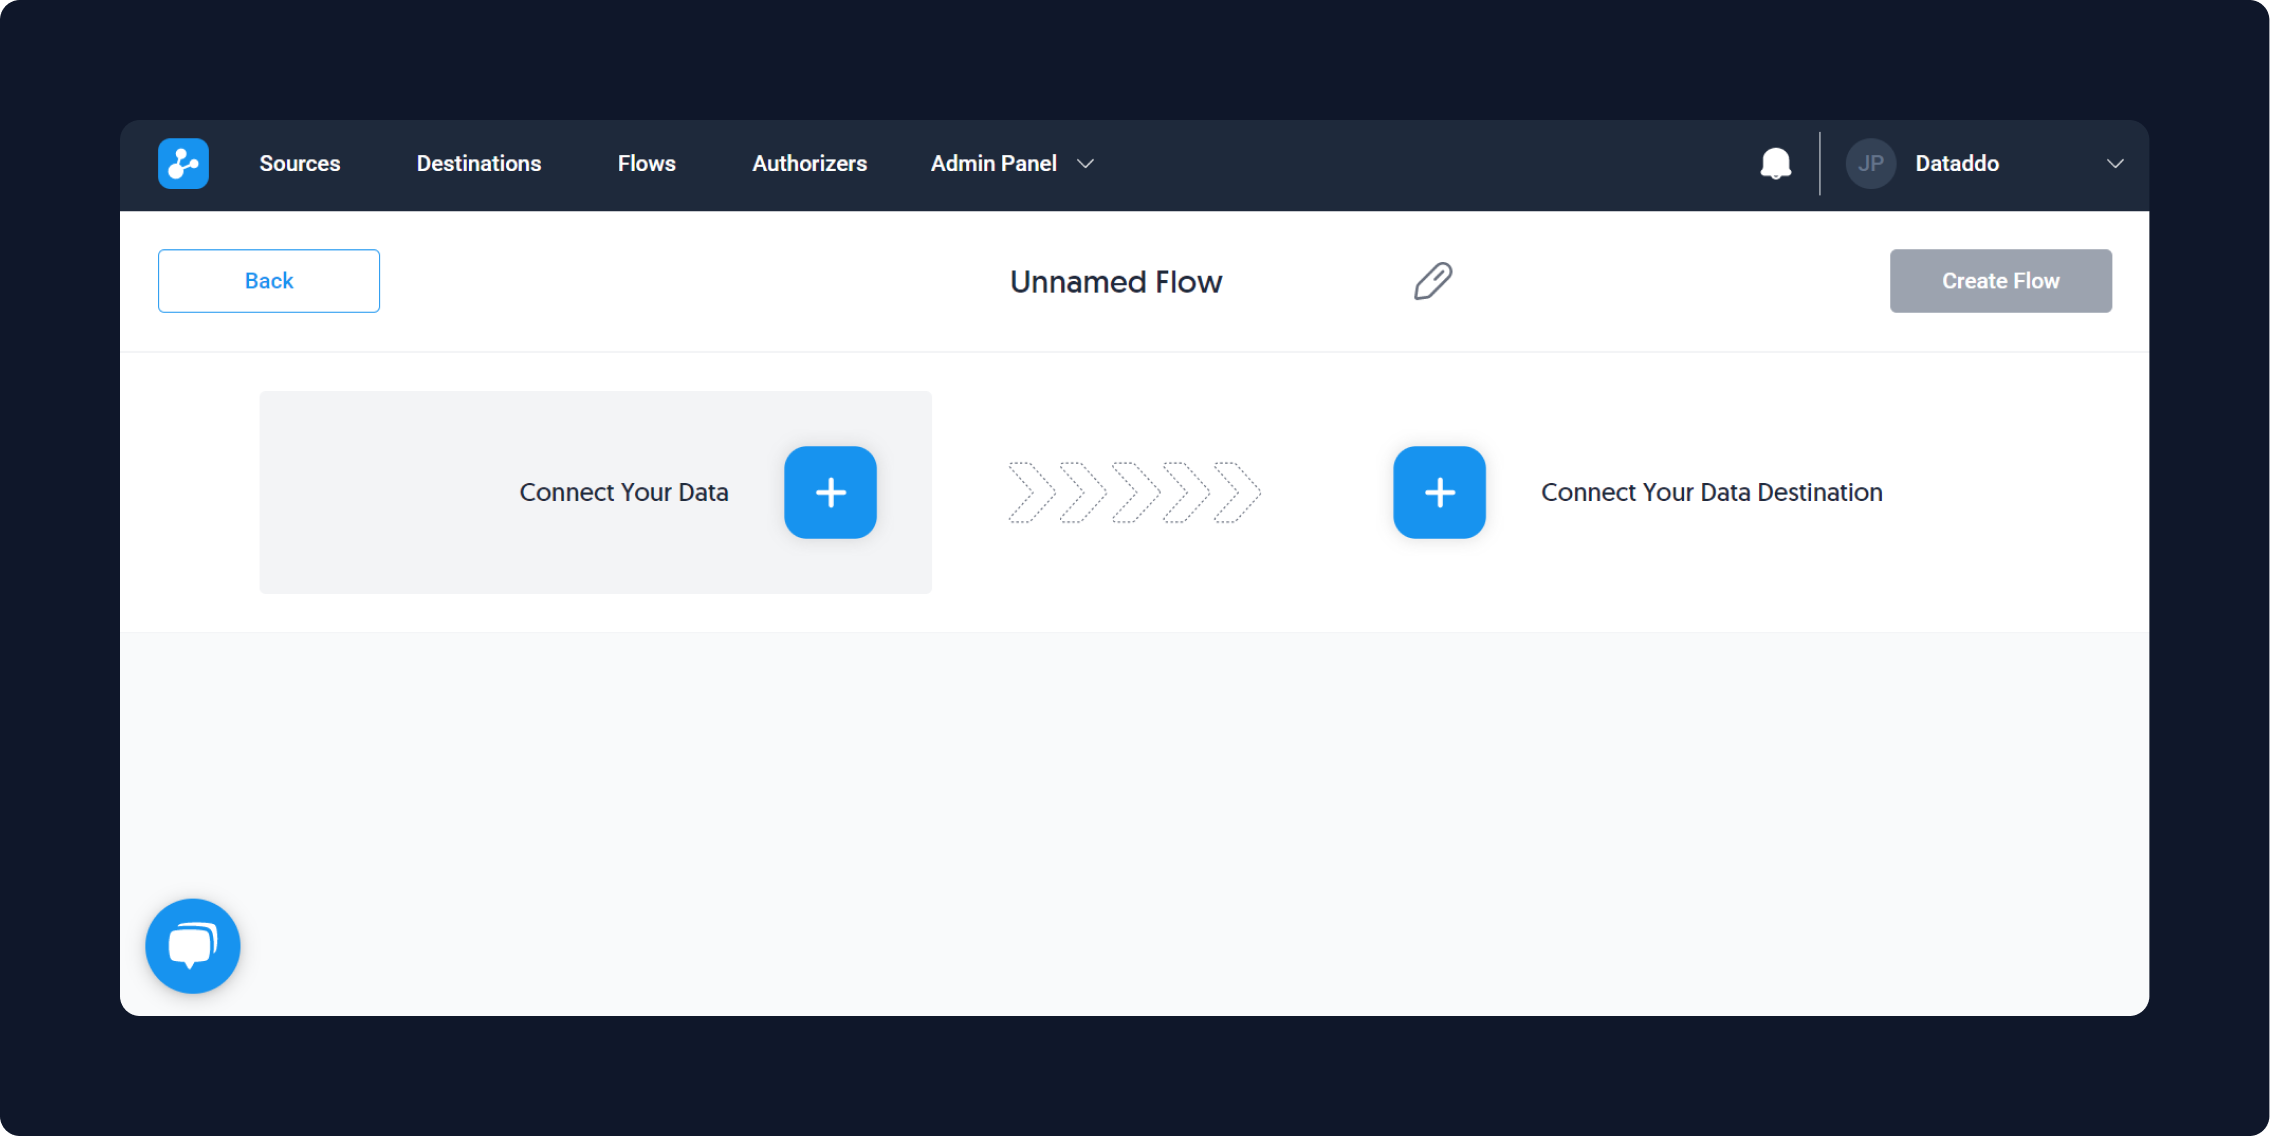
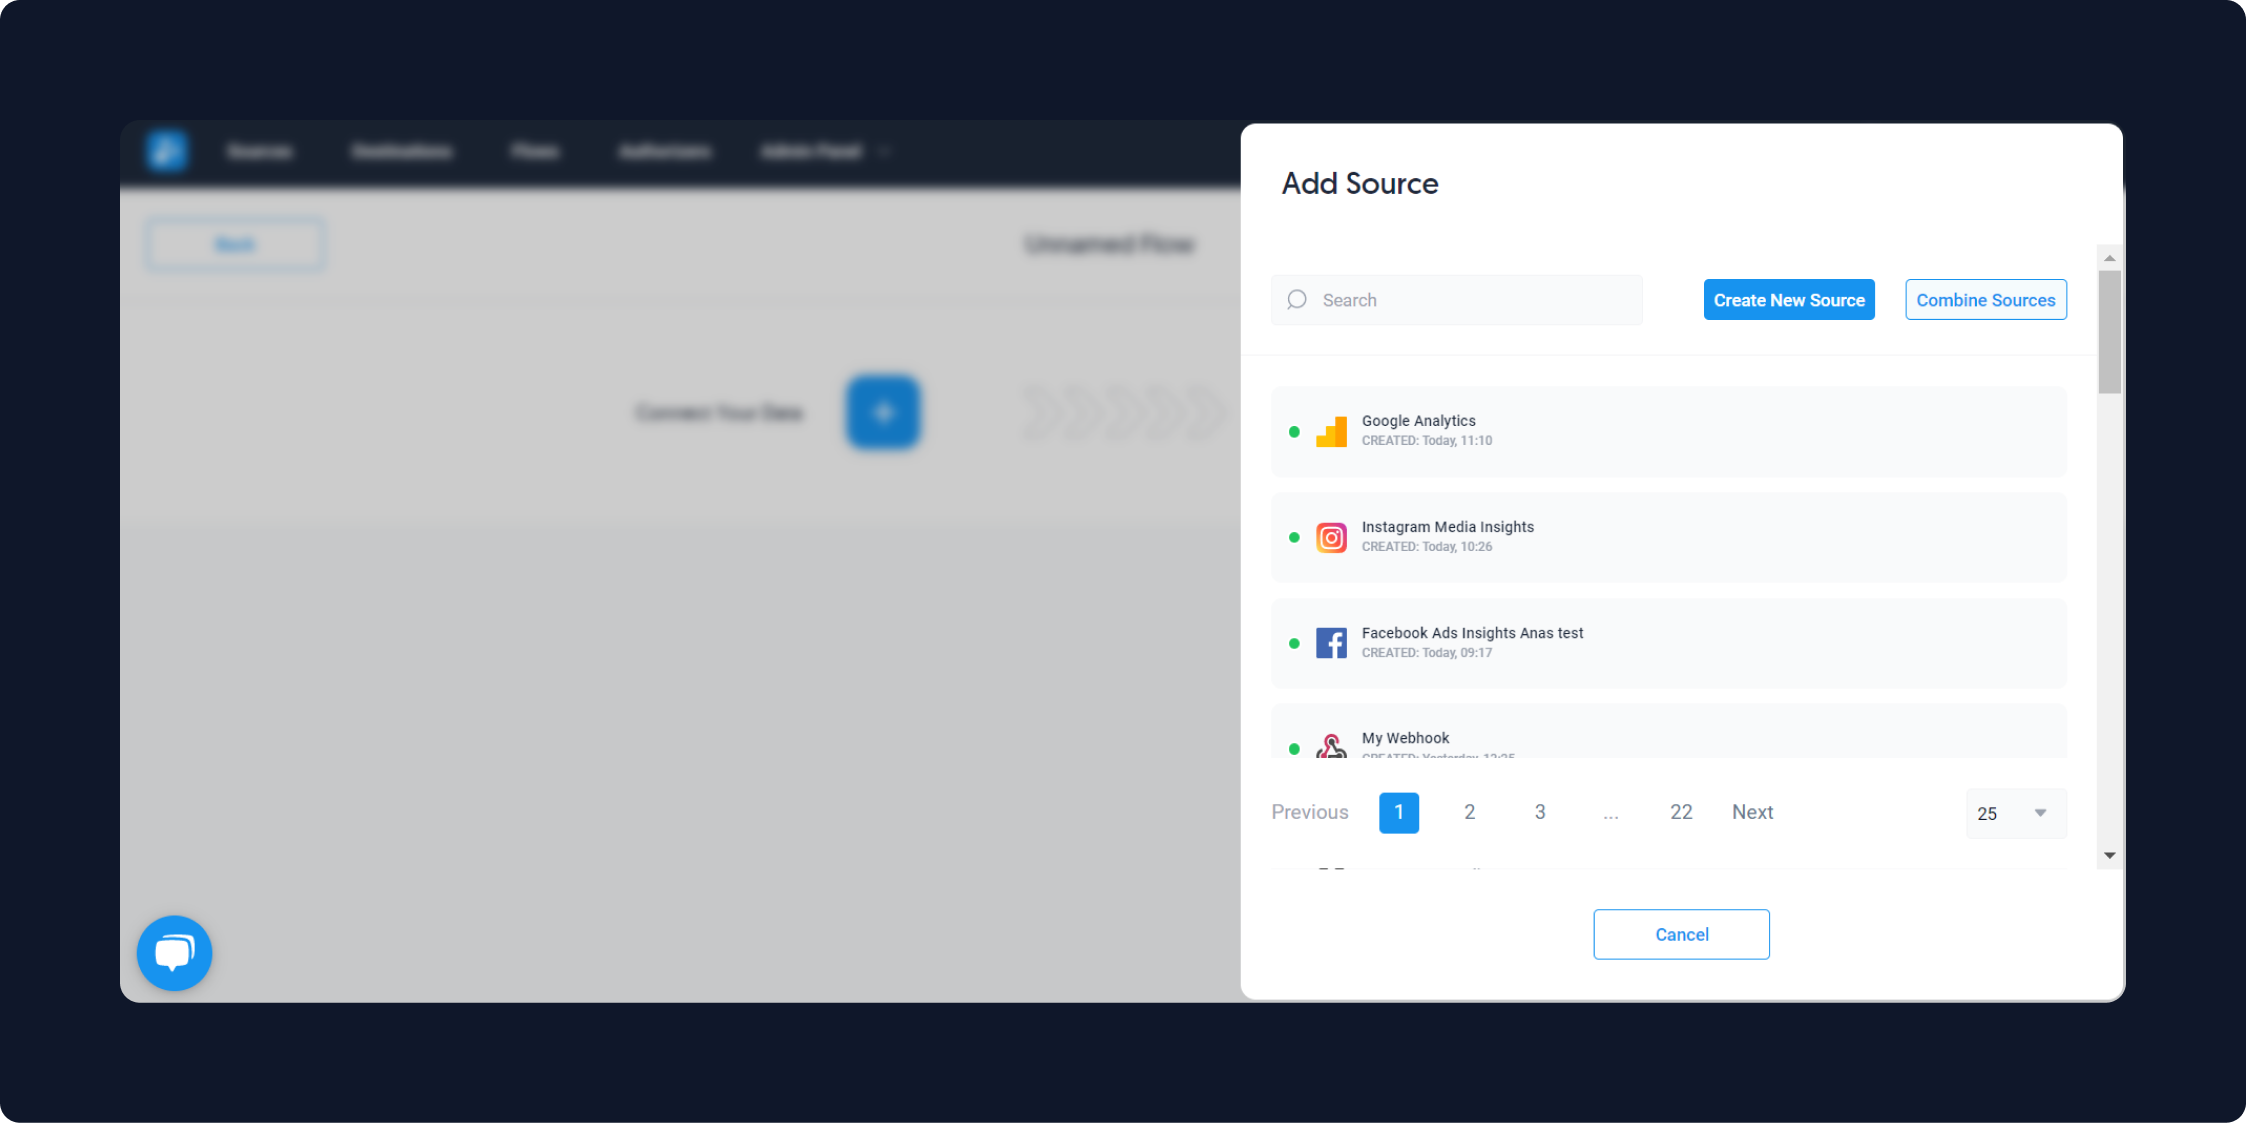
Click 'Connect Your Data' and select 'Combine Sources' on the right side of the panel pop-up.
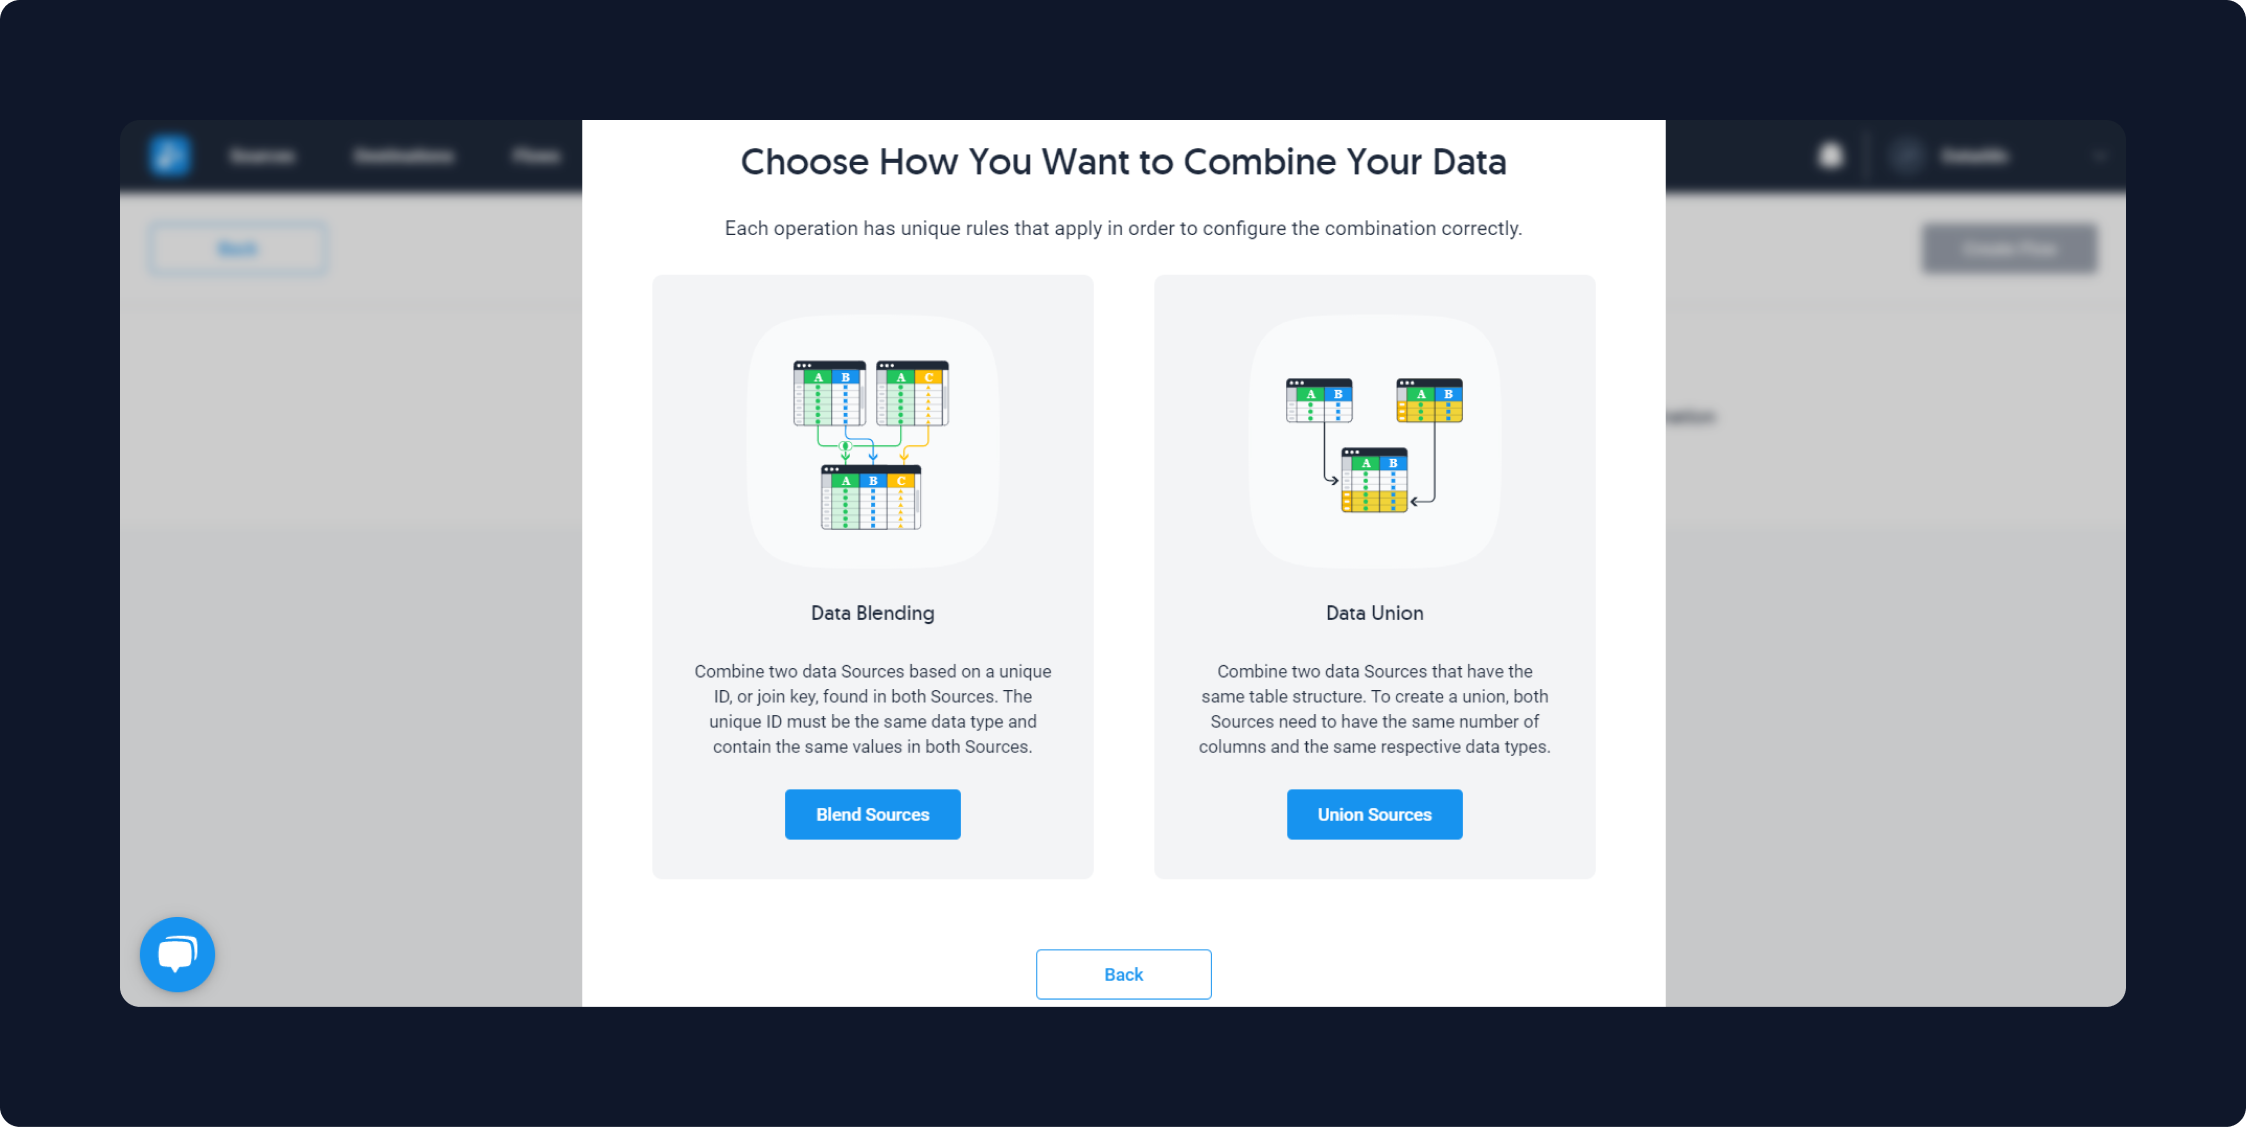
Next, choose how you want to combine your sources—blend your data or create a data union.
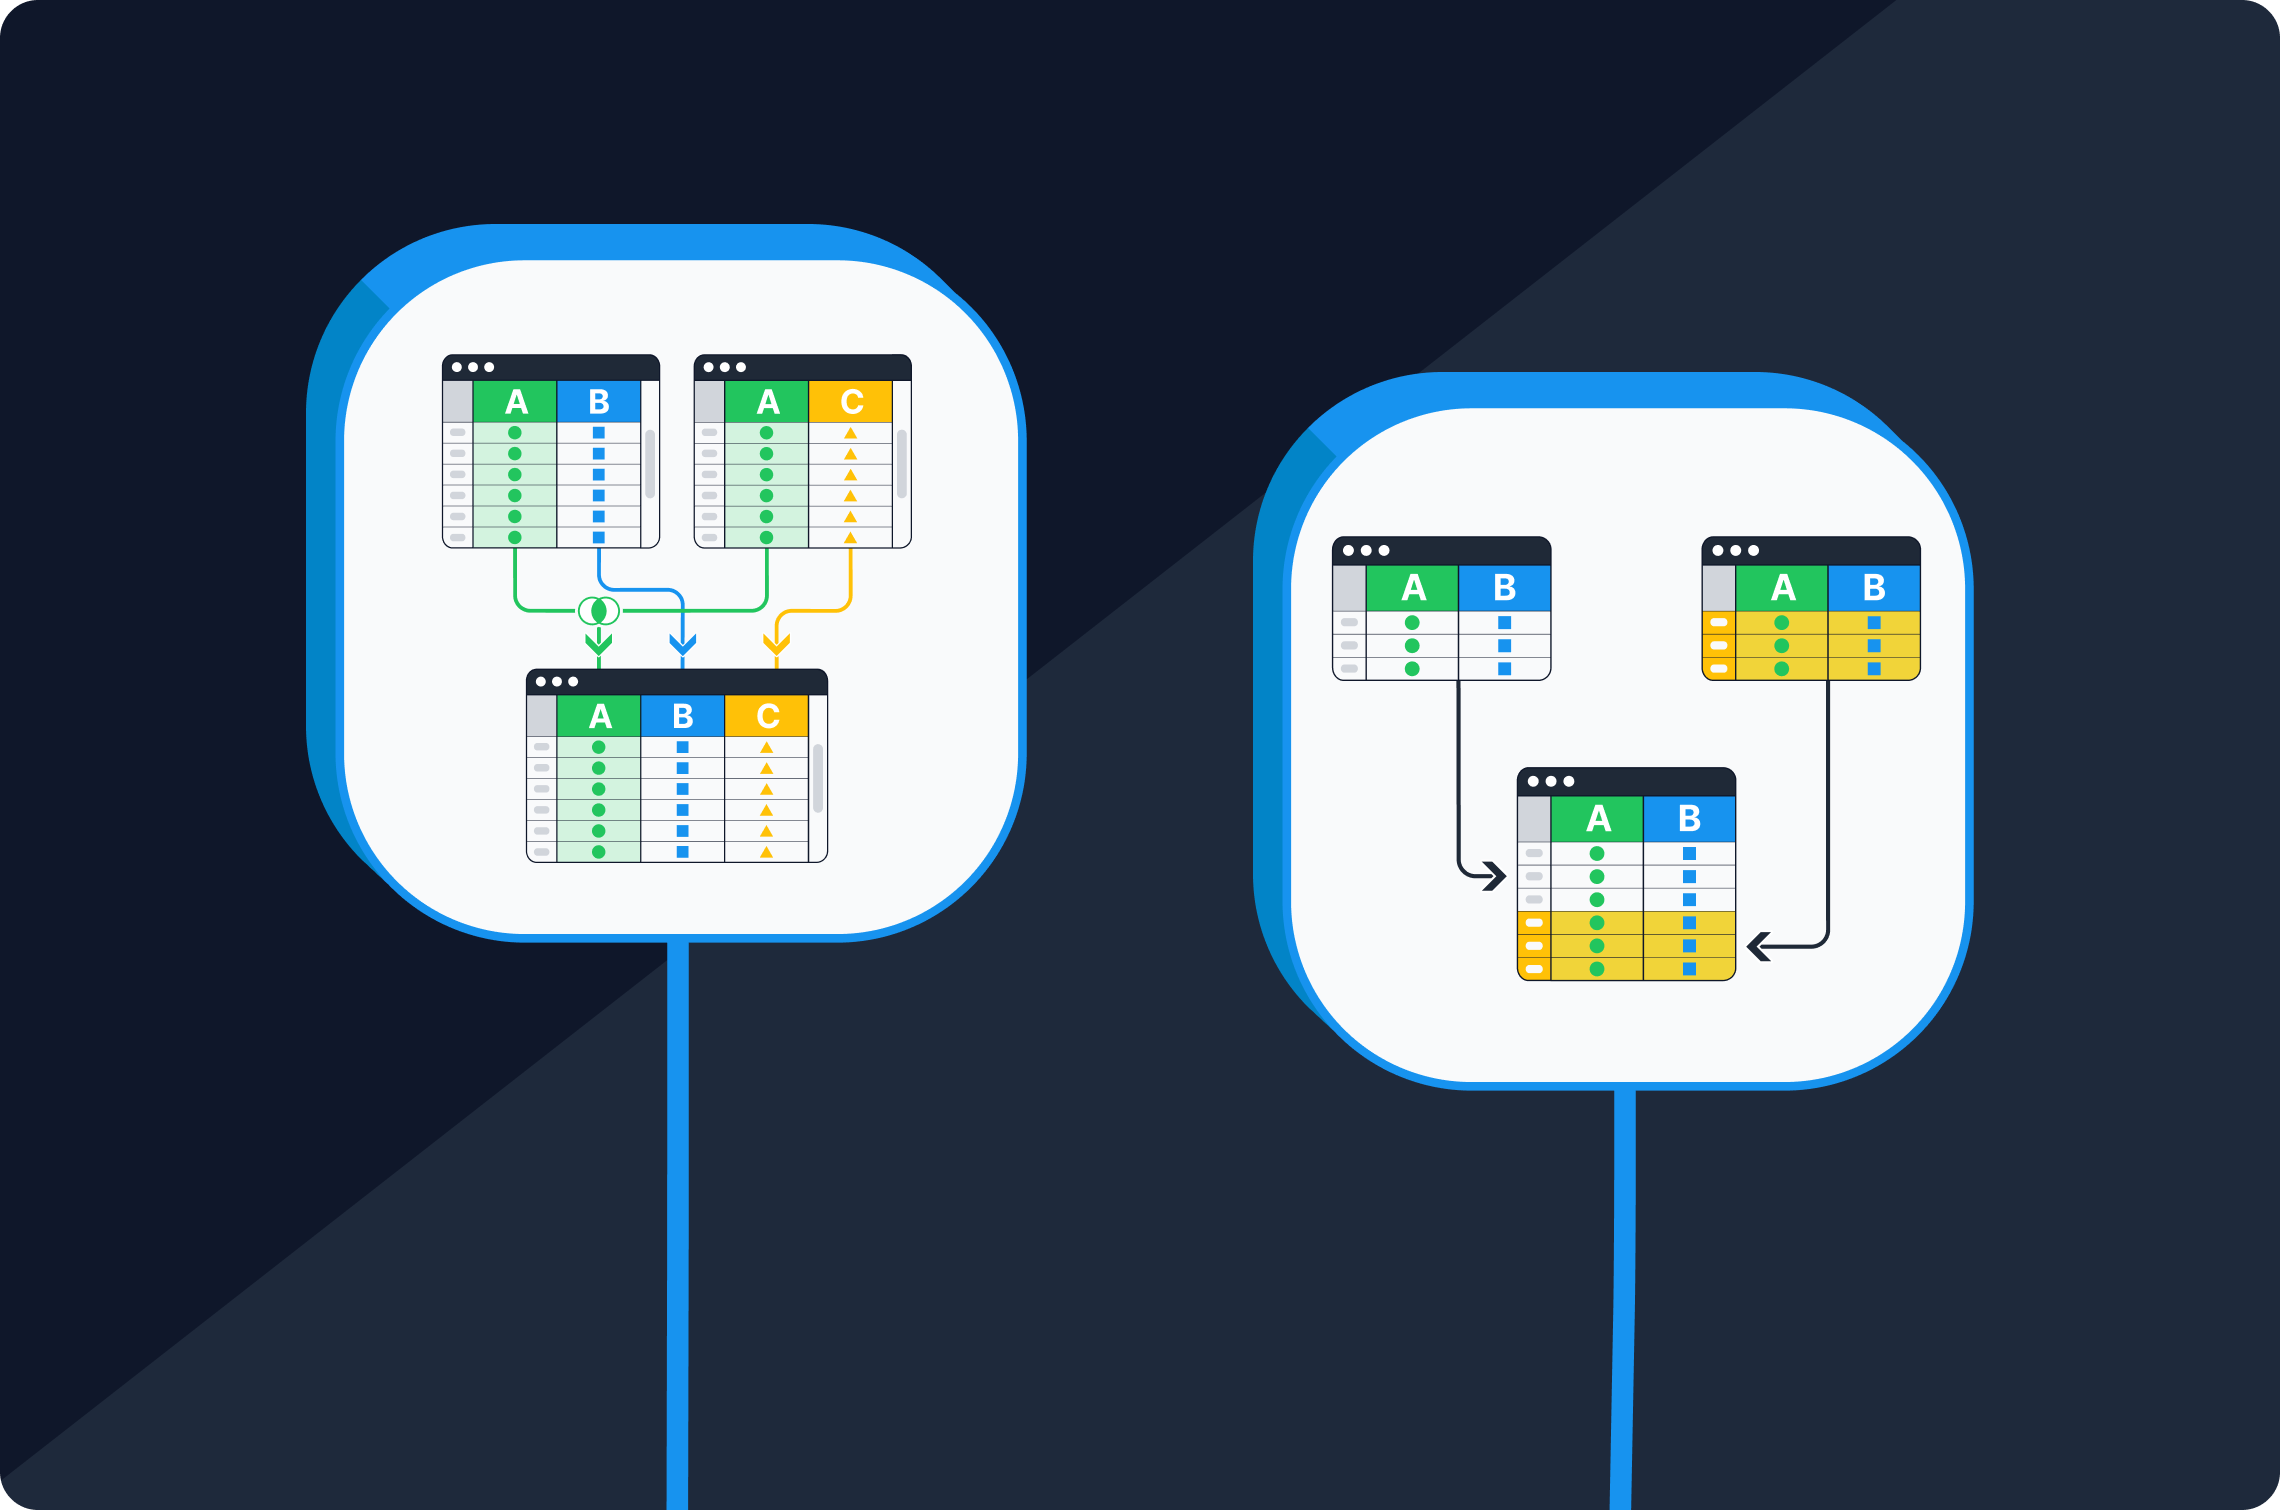
Blend Data
Blending data is combining two data sources based on a unique ID, or join key, found in both sources. The unique ID must be the same data type and contain the same values in both sources.
In the Dataddo app, you can select what kind of join you would like to use - left join, right join, or inner join.
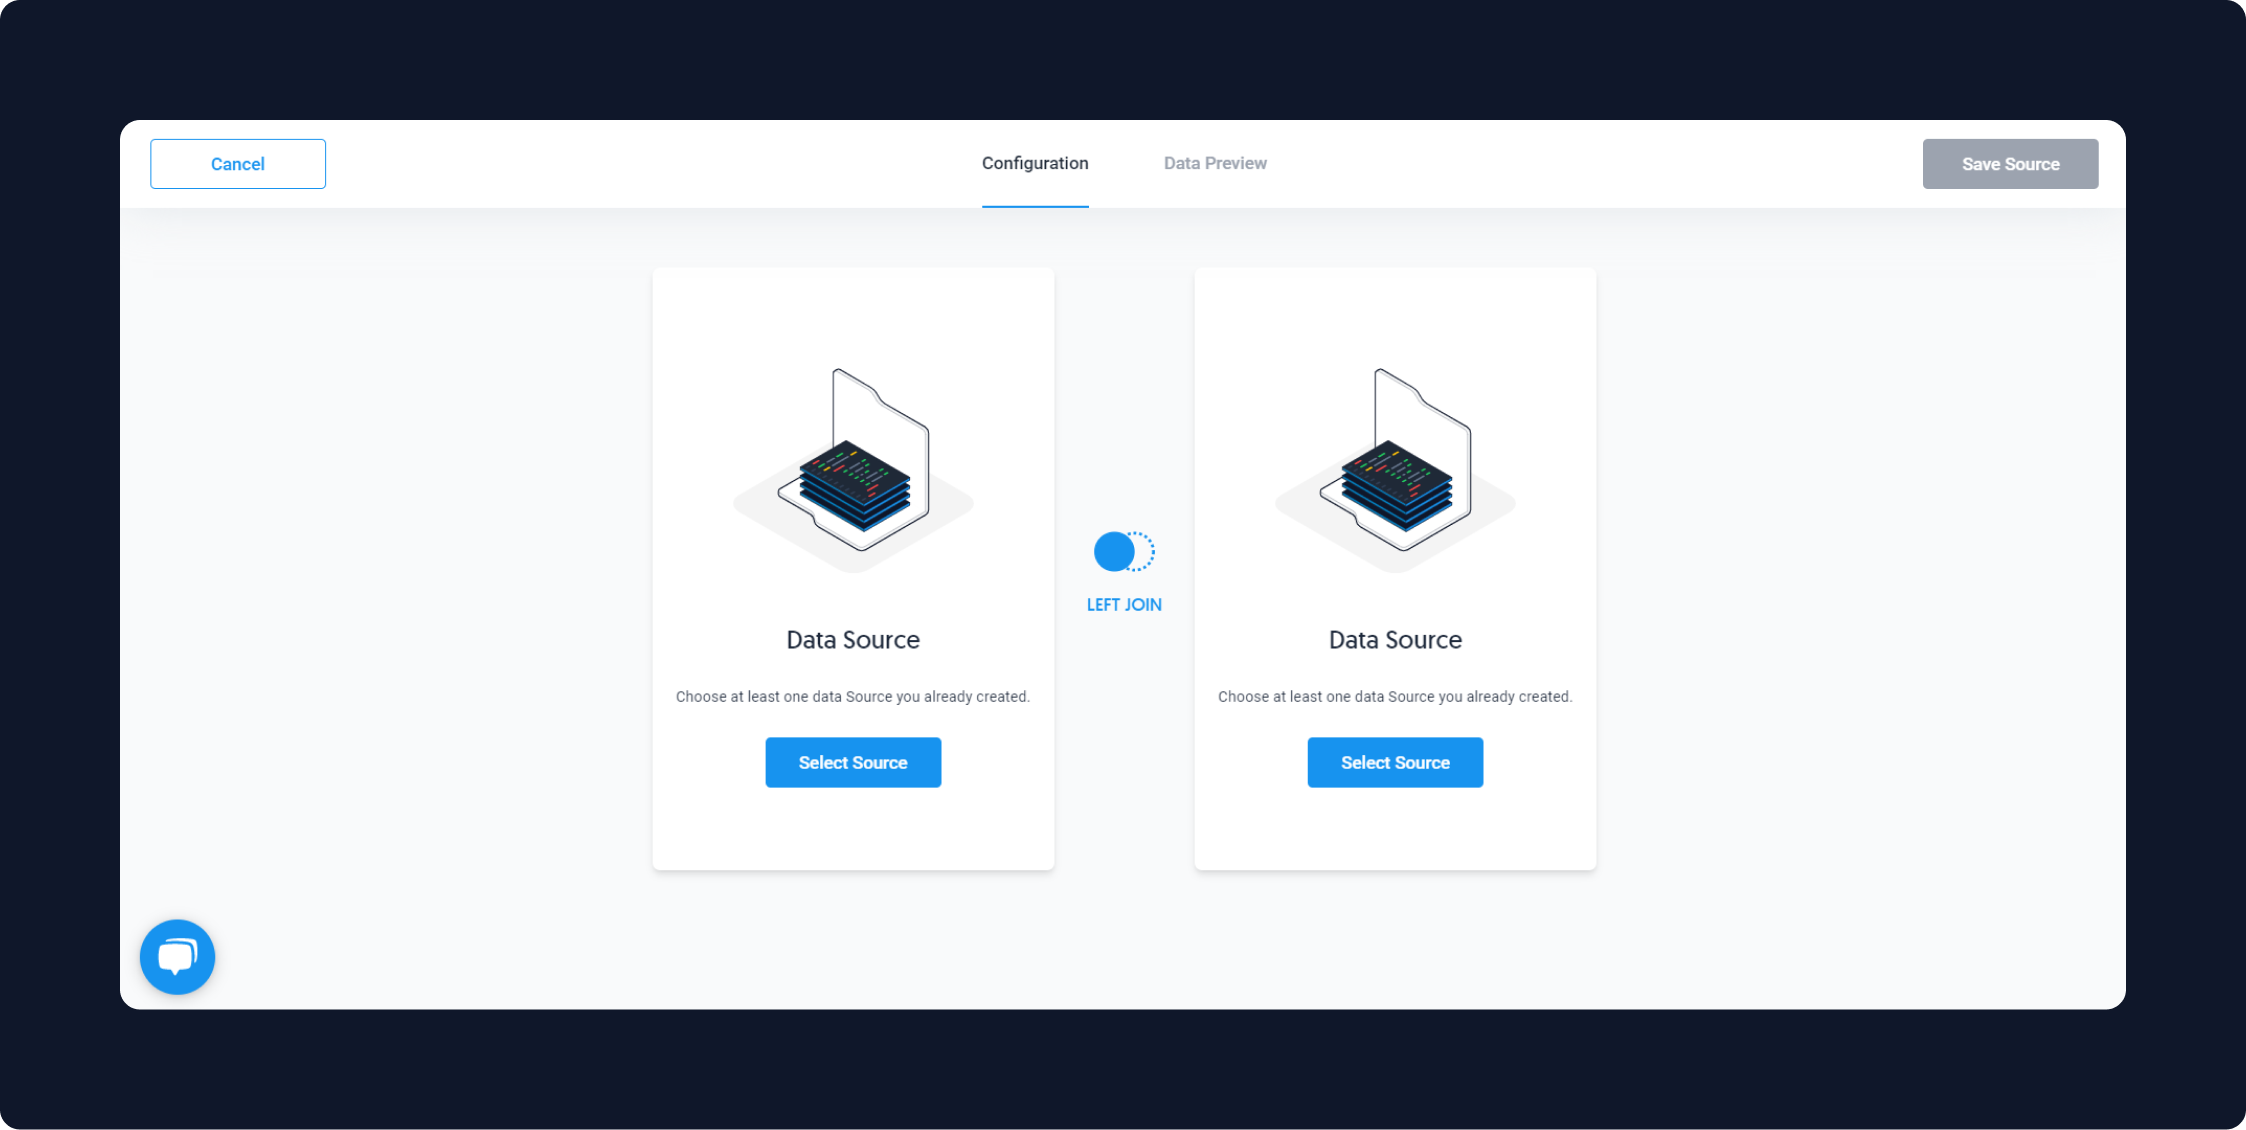
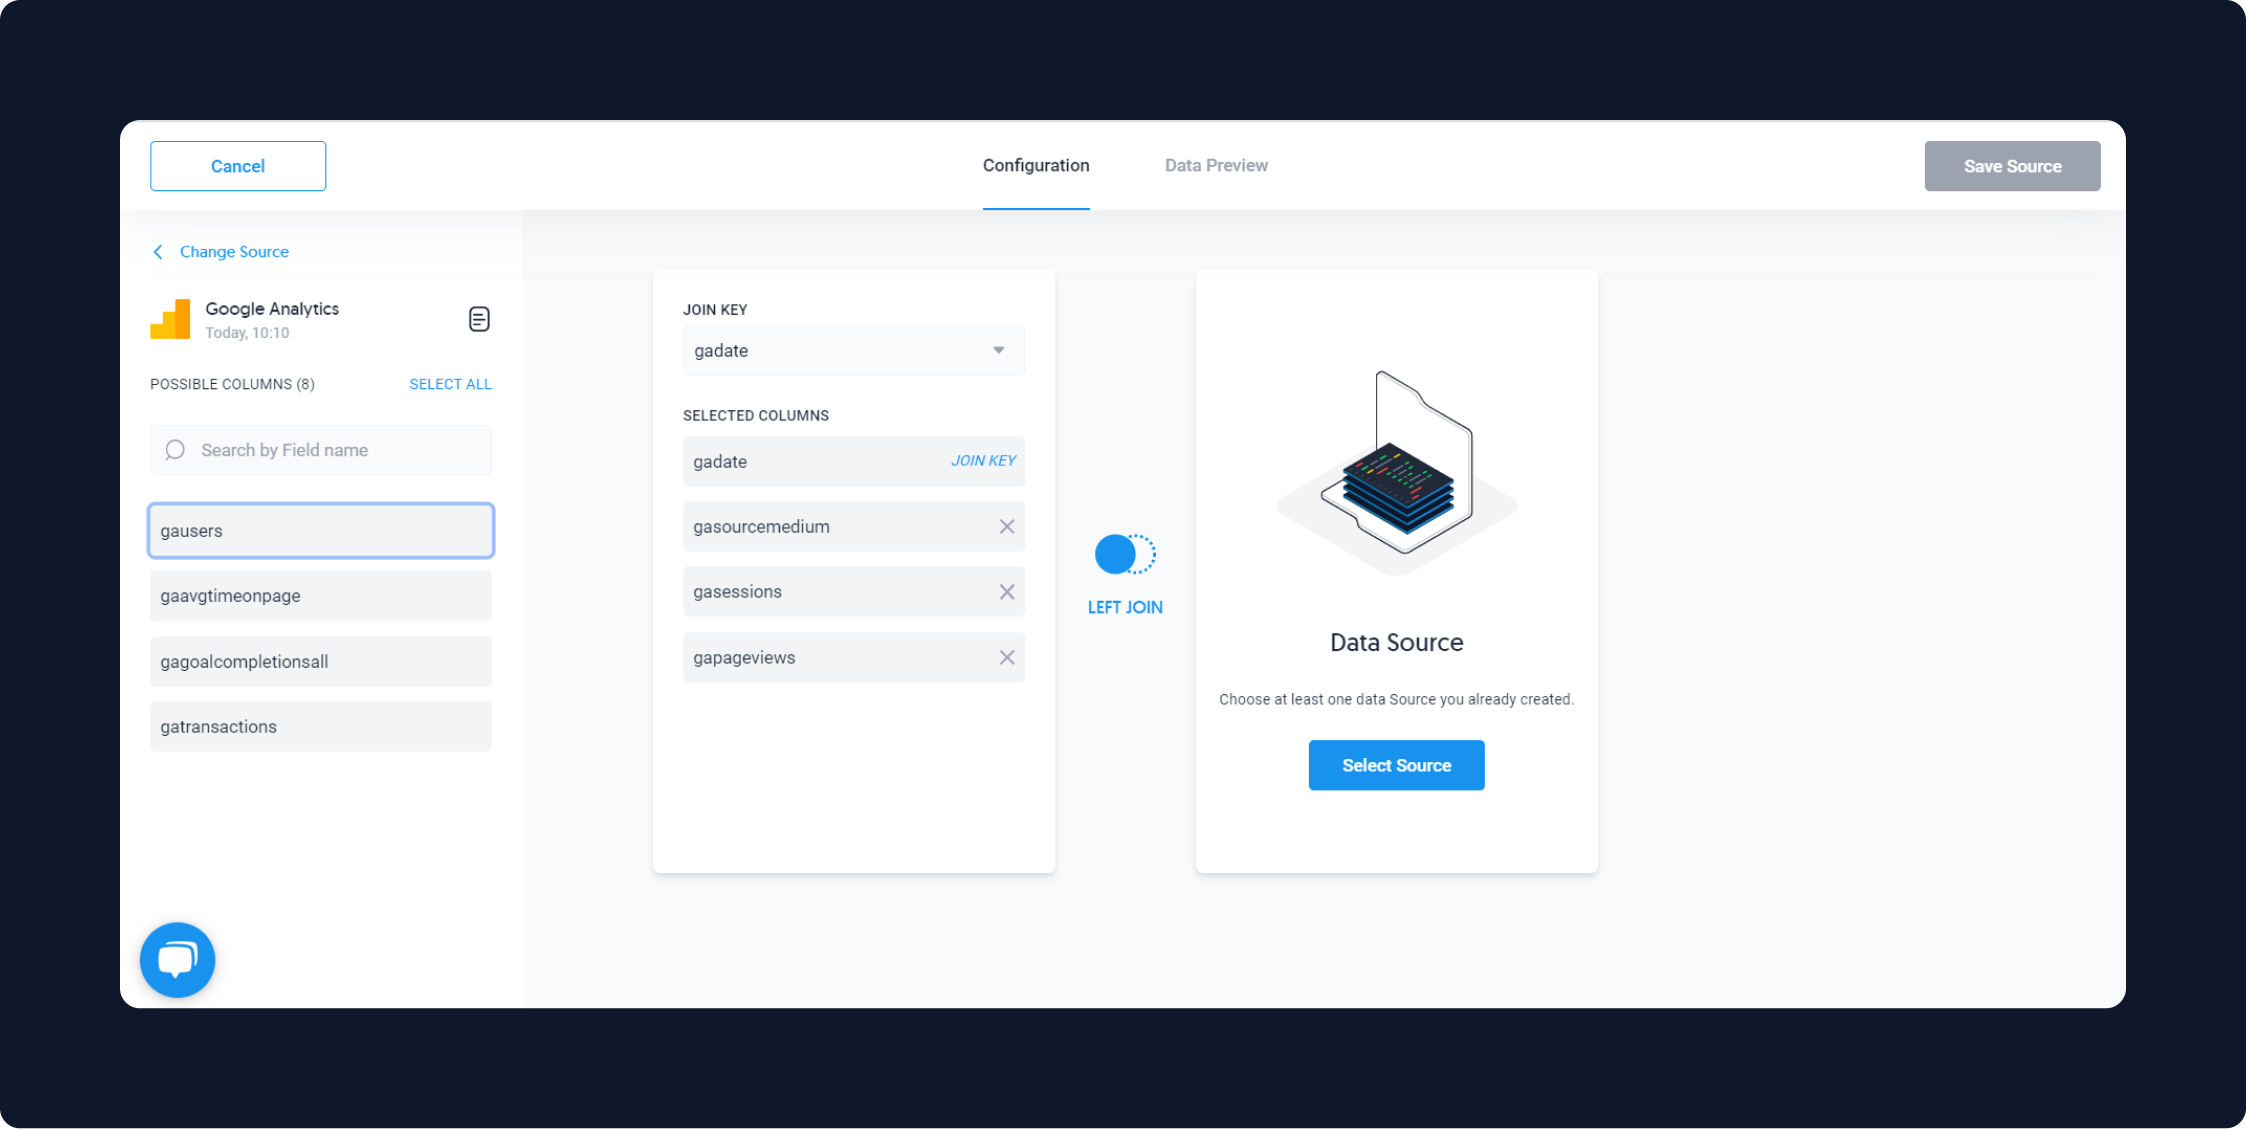
Select what kind of join you would like by clicking on the icon in the middle. Then select your first source and the unique join key you'd like to use. Select the other attributes you would like to include from the first source.
Next, select your second source, your join key from that source, and the attributes you would like to join.
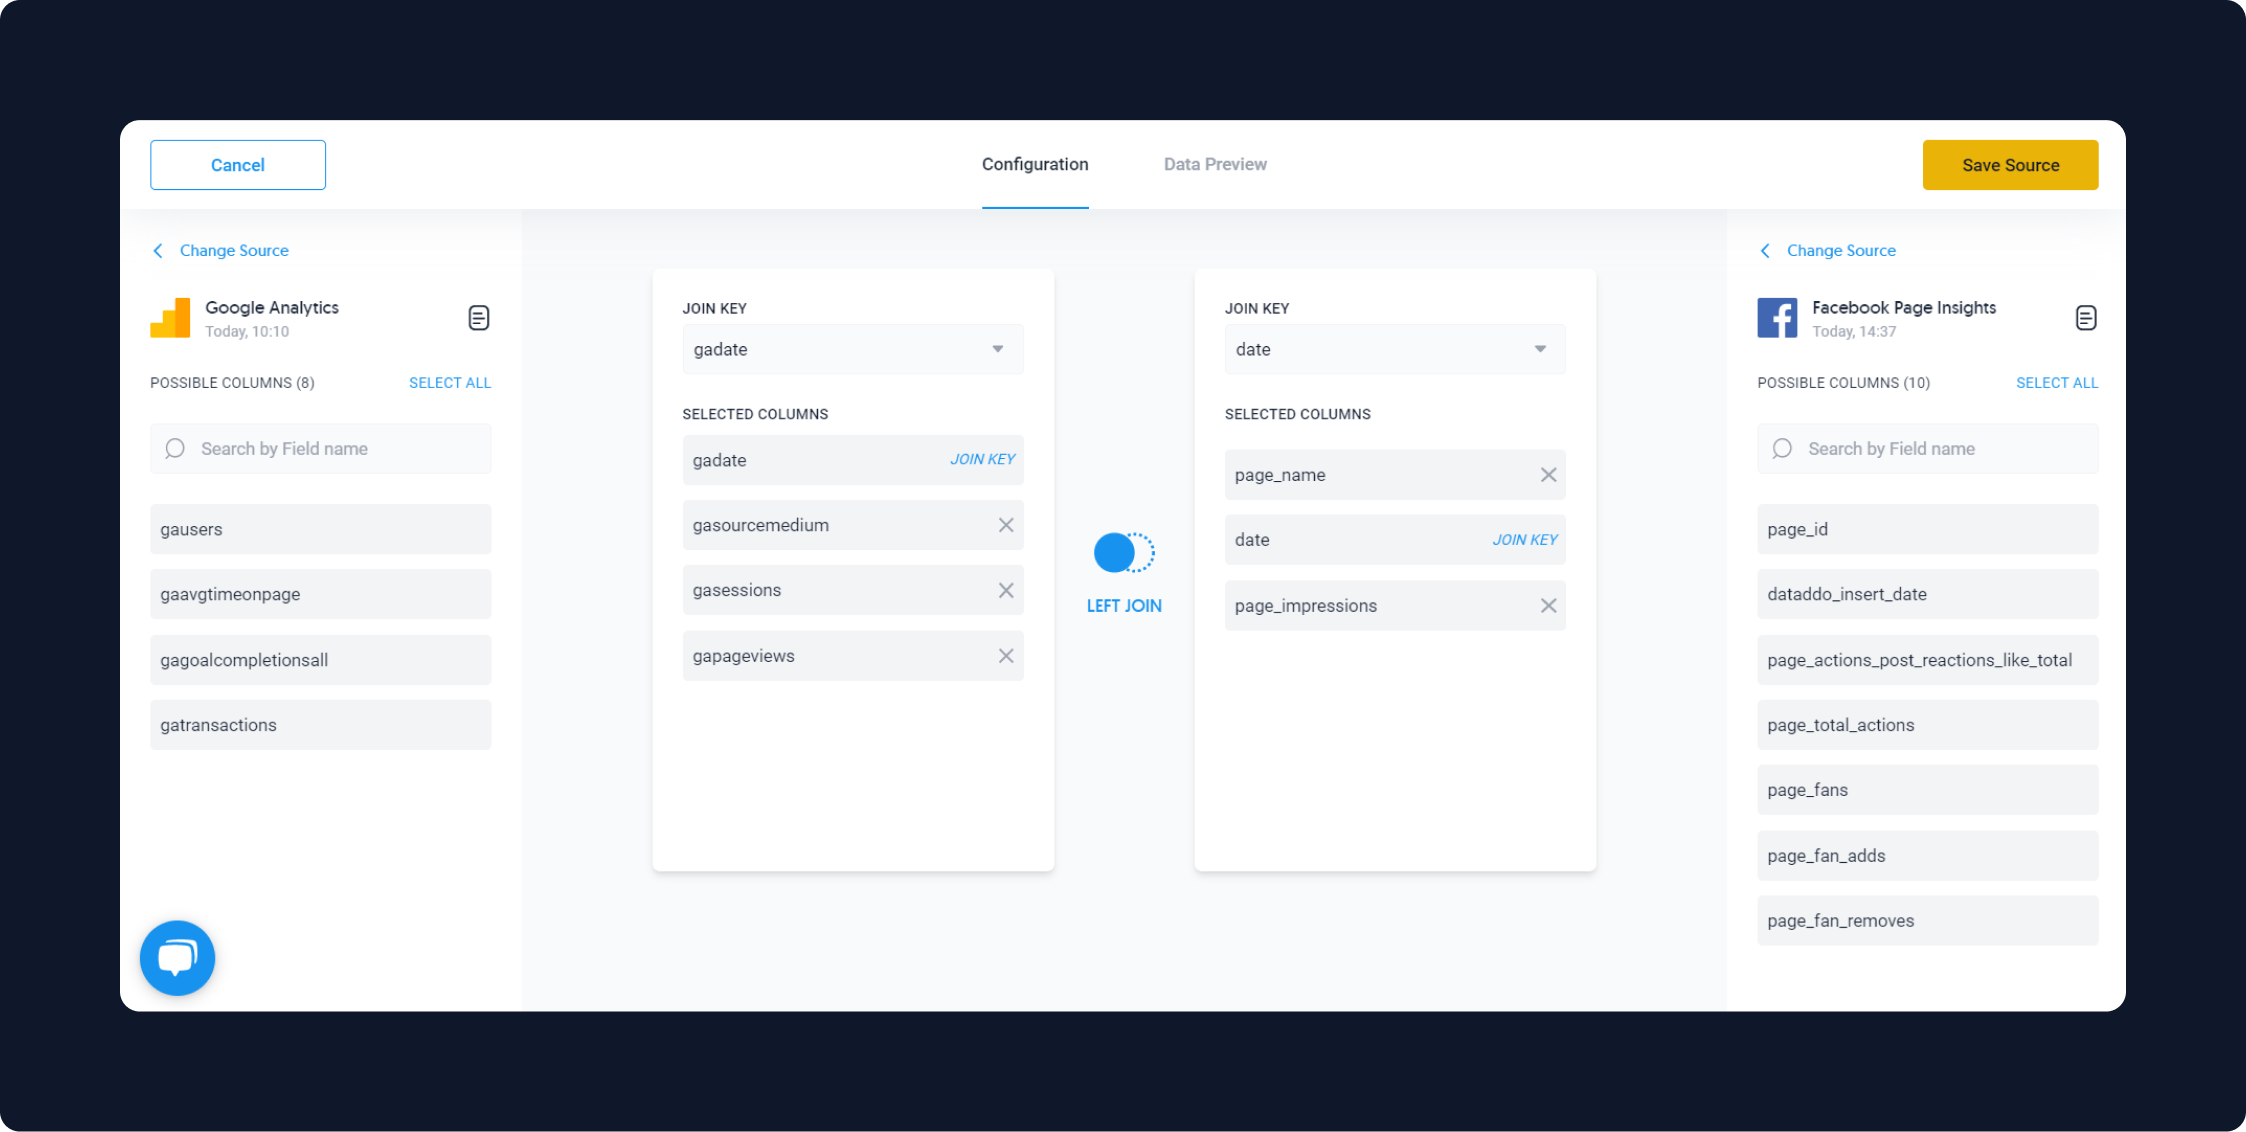
Save your source and complete your flow. Once your destination has been configured and your flow has been saved, you will find your blended data source directly in your destination.
Data Union
A data union is the combining of two data sources that have the same table structure. To create a union, both sources need to have:
- the same number of columns and
- the same respective data types.
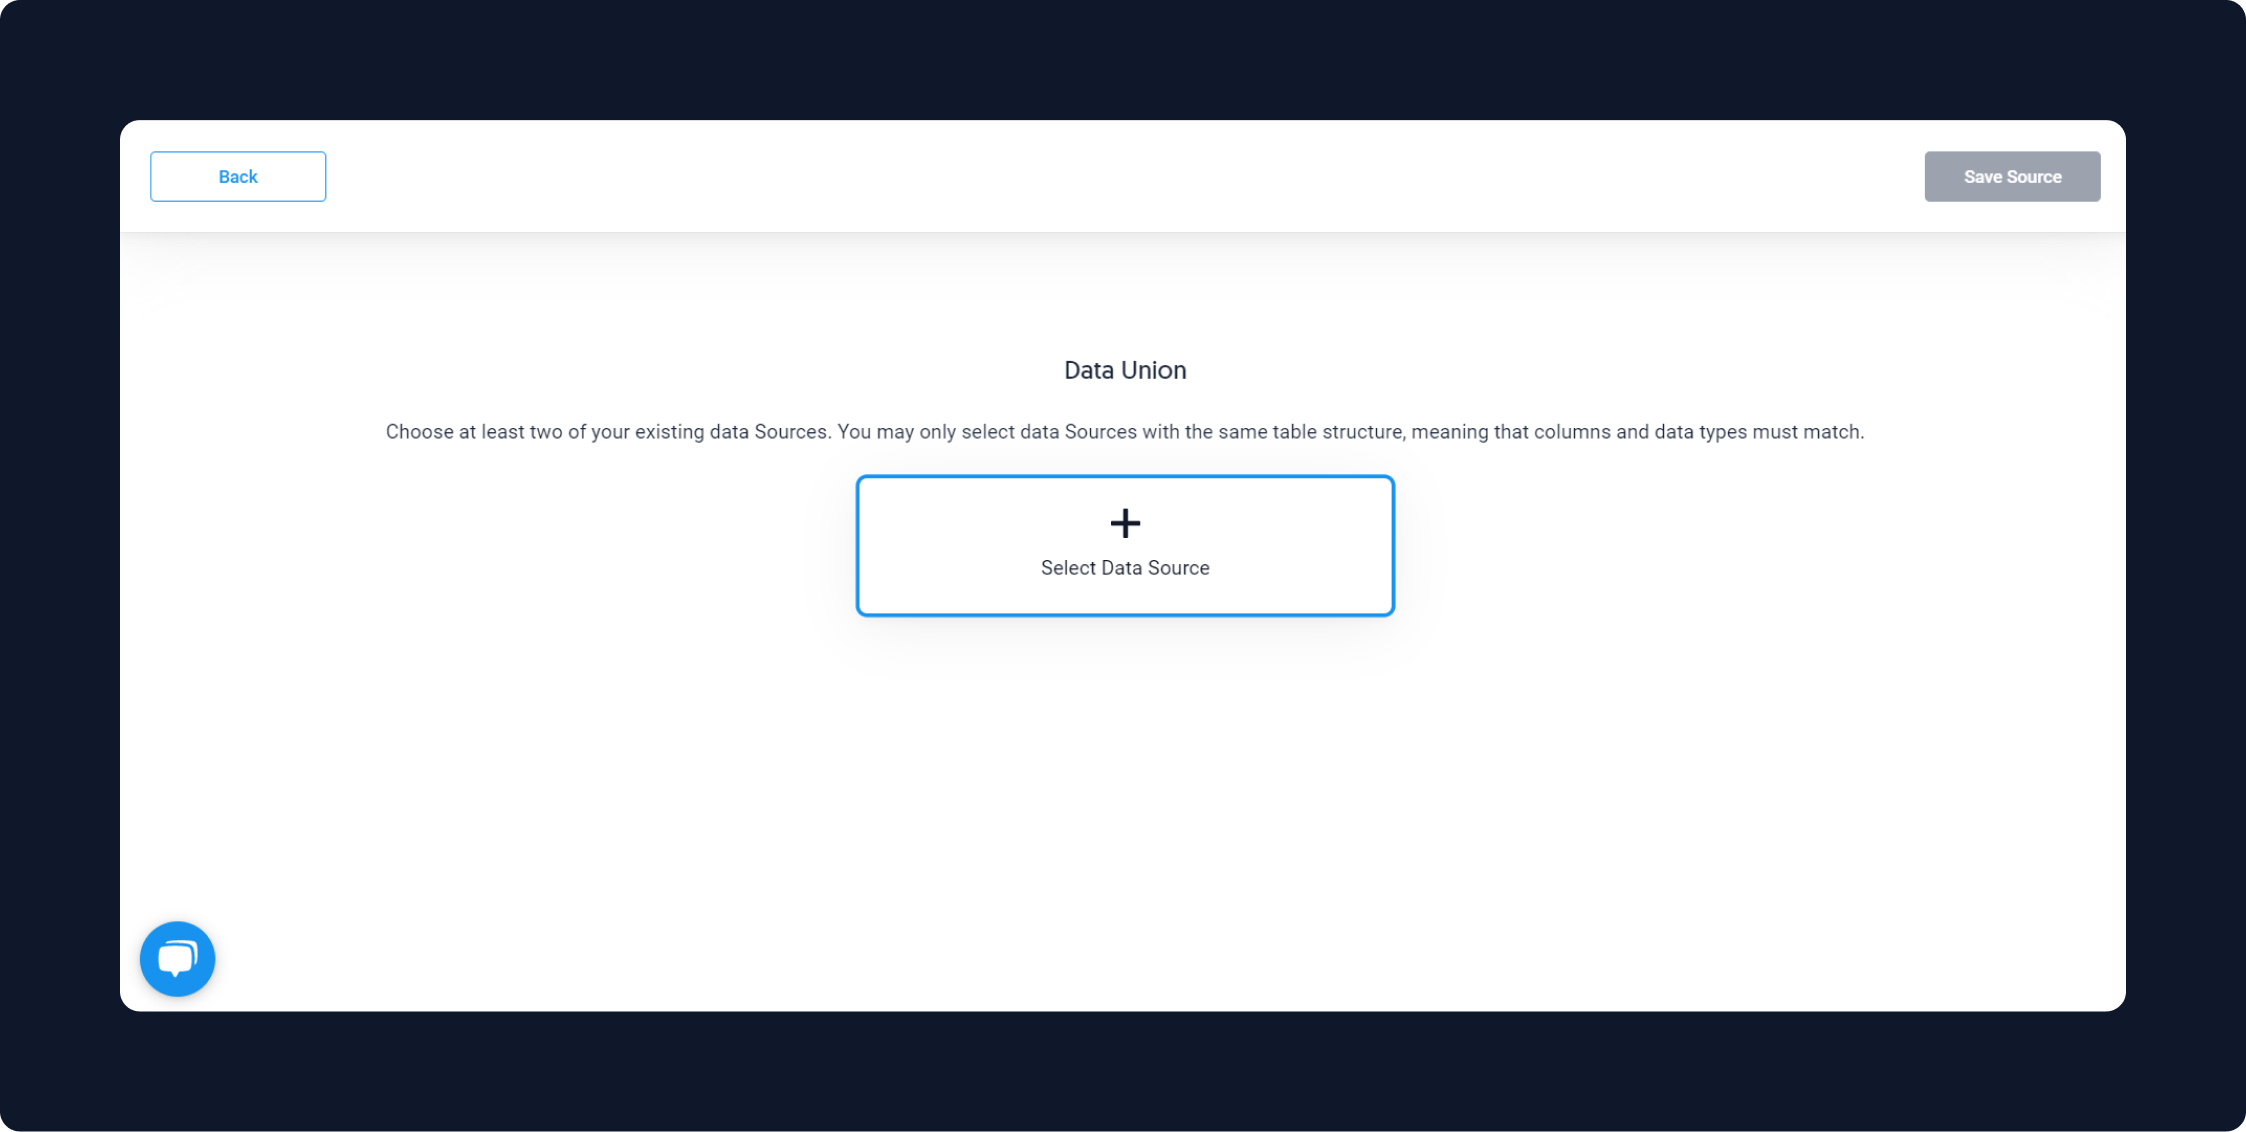
After you add your first source to the union, you will only be shown your saved sources that are compatible with the first source you selected, meaning they have the same number of columns and same data types.
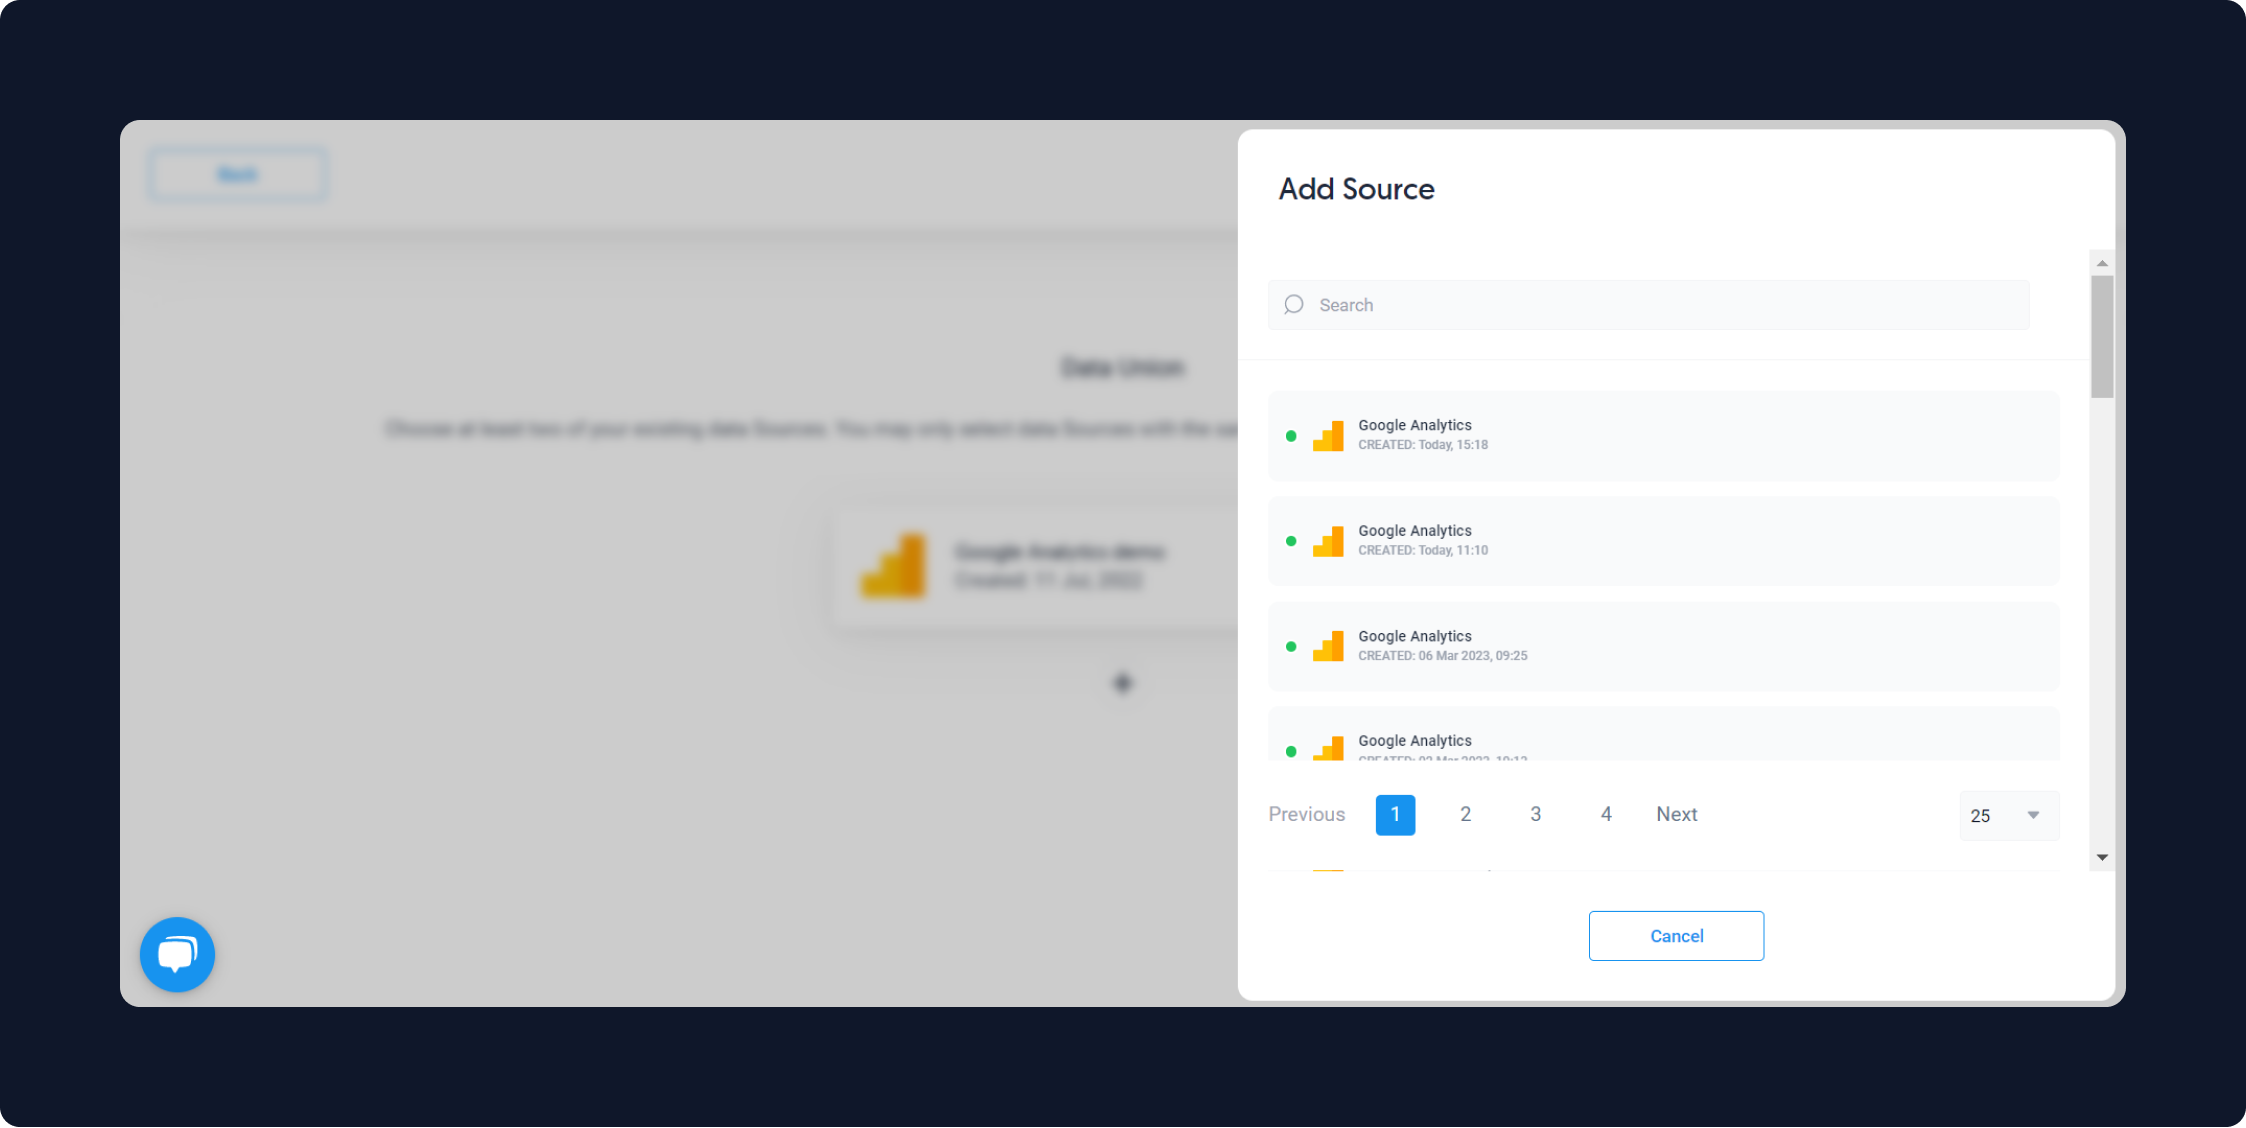
You may select as many sources as you like as long as they are all compatible.
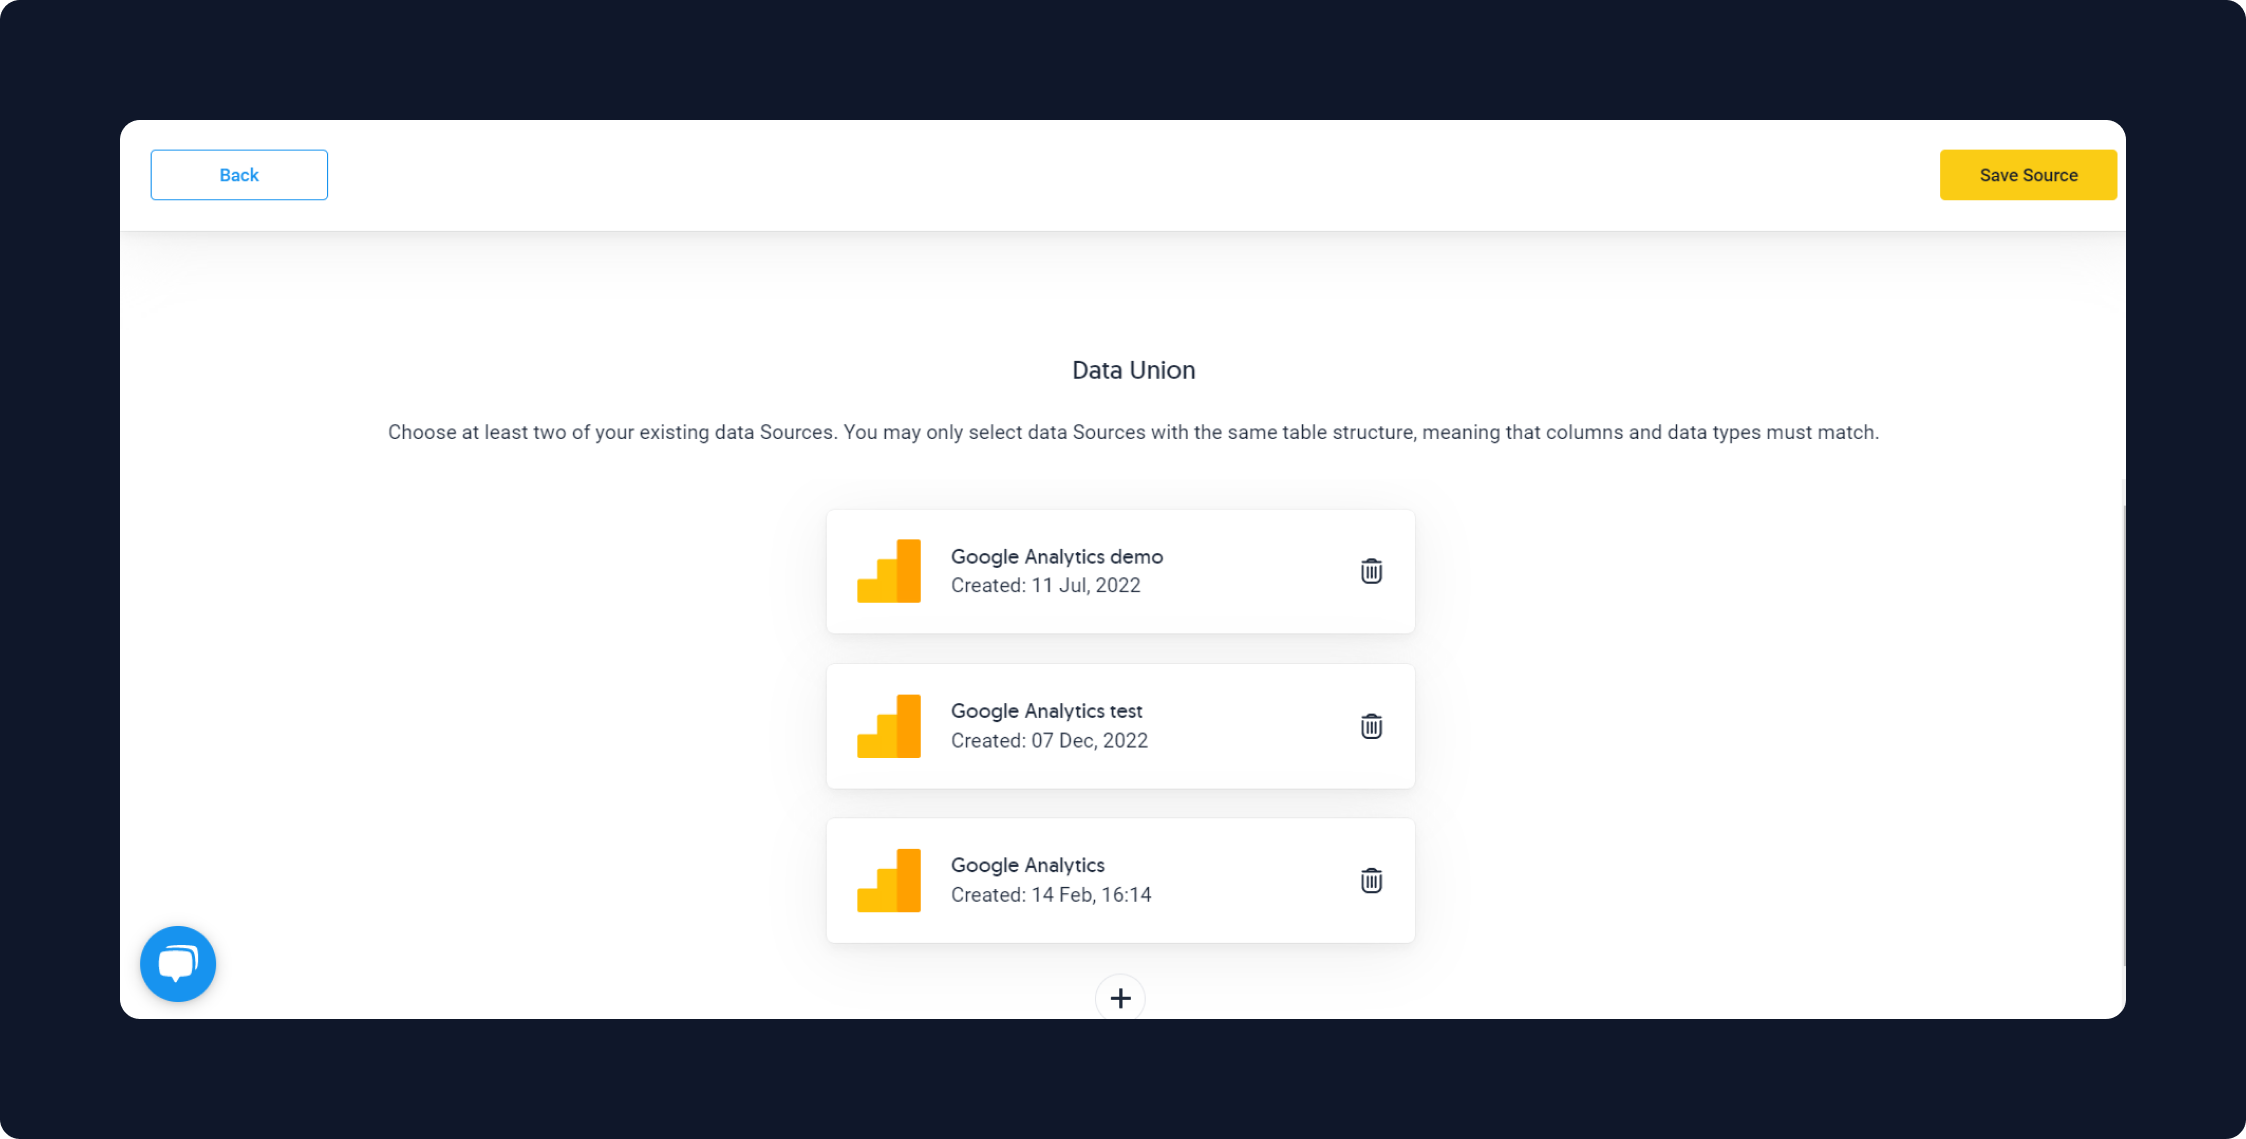
Once you select the sources you would like to union, save your source. Complete your flow by adding your destination. Your data union will then be available directly in your destination.
Why Dataddo for Data Transformations?
While you can find blending and union functionalities in many dashboarding tools, those tools are limited and can often be complicated. Using Dataddo, you can combine data to best suit your needs, and send organized datasets to your dashboards for even easier visualization.
Overcome the data combining limitations of your dashboarding tool with Dataddo.
|
Easy Data Combination Is Just Minutes Away Sign-up or log into Dataddo to expand the data blending and union functionalities of your dashboarding app.
|

Additional Power BI Tips, Tricks, and Resources
Continue reading the Dataddo blog for more Power BI tips, tricks, and resources!
- Smarter Financial Dashboards for SMEs (with Free Power BI Template)
- How to Connect NetSuite to Power BI: ODBC vs. Dataddo
- How to Connect Google Sheets with Power BI: Direct vs. Dataddo
- How to Connect Stripe to Power BI: Direct vs. Dataddo
- How to Connect Sage Accounting to Power BI for FREE: Direct vs. Dataddo
- How to Connect Google Analytics to Power BI for FREE: Direct vs. Dataddo
- How to connect JSON with Power BI: Direct vs. Dataddo
- How to Connect SEMrush to Power BI for FREE
- How to Connect Xero to Power BI With Dataddo for Free
- Connecting Xero to Power BI: Native or Third-Party Connector?
- How to Integrate Exact Online Data with Power BI (or any BI Tool)
- Power BI vs Tableau: The Breakdown

Comments