
For data scientists and analysts, the true capabilities of Power BI lie in the language of DAX (Data Analysis Expressions).
DAX is a formula language that enables users to perform complex calculations, measures, and data models. Mastering DAX is important to embracing Power BI's full capabilities, as it enables users to create complex data models that go beyond the tool's standard functionality.
Let's explore advanced DAX functions in Power BI that will take your data analytics to a whole new level.
Click to skip down:
- What is DAX and what can you do with it?
- Fundamental concepts of DAX for Power BI users
- Setting up Power BI for DAX
- Essential DAX functions and techniques
- Why use Dataddo to bring all your data together in Power BI?
- Additional Power BI tips, tricks, and resources
What Is DAX and What Can You Do with It?
DAX is a formula language specifically designed for Power BI, Analysis Services, and Power Pivot. DAX encompasses a library of over 200 functions, operators, and constants that can be combined to build formulas and expressions for complex data analysis tasks. Think of DAX as the hidden superpower of Power BI—a set of instructions that manipulate, analyze, and transform your data into a format that unlocks deeper insights.
While Power BI's visual tools are undeniably powerful, DAX empowers you to:
- Understand the language of data. DAX is essentially a "code language" that allows you to manipulate and analyze your data directly.
- Transform your data into a format that suits your analysis needs perfectly. Use it to set up custom calculations, filter data precisely, and build new dimensions.
- Craft dynamic visualizations that update automatically based on real-time data changes.
- Tackle complex analytical challenges that pre-built features simply can't handle.
Fundamental Concepts of DAX for Power BI Users
Before discussing advanced DAX techniques, let's solidify the foundational concepts of DAX in Power BI.
Syntax and Formula Structure
DAX formulas follow a specific syntax, similar to Excel formulas but tailored for Power BI's data model. Understanding this syntax is crucial for writing clear and efficient DAX expressions.
Data Types and Their Usage in DAX Expressions
DAX supports various data types, including:
- Numeric: For integers and decimals.
- Text: For strings.
- Date/Time: For dates and times.
- Boolean: For true/false values.
Tables, Relationships, and Context in Power BI
DAX operates on tables and columns instead of individual cells. There are two types of context in DAX:
- Row Context: This applies to the current row being evaluated in a calculated column.
- Filter Context: This applies to the filters applied to a report, affecting calculations in measures.
Calculated Columns vs. Calculated Measures in DAX
Both calculated columns and measures are essential tools in your DAX toolbox, but they serve different purposes:
- Calculated Columns: These columns are for data transformation. They permanently modify a table by adding a new column with a specific calculation, such as adding a "Profit Margin" column by calculating sales minus cost.
- Calculated Measures: These are best for creating dynamic calculations. They don't alter the underlying data but provide a summarized view based on existing columns and filters. Think of a measure calculating "Total Sales by Quarter" that adjusts automatically when users select different quarters.
Setting up Power BI for DAX
Before diving into more advanced DAX functions and techniques, it’s essential to set up your dataset in Power BI and understand how to create measures and columns. This will ensure you can follow along with the examples provided.
Uploading Your Dataset in Power BI
To follow the examples provided later, navigate to Use sample data from Power BI’s home page, as shown below:

After this, select financials and click Load.

Creating a Measure
In Power BI, measures are calculations or aggregations on data sets that provide insights. To initiate the creation of a measure, navigate to the Table view on the left-hand side, then right-click on the desired column where you intend to create the measure.

Creating a Calculated Column
A column is a calculated field that you can append to a table within your data model. It derives its values from one or more existing columns and is computed according to a specified formula, essentially DAX functions.

Once you've taken these steps, you'll be ready to follow the examples below.
Essential DAX Functions and Techniques
DAX offers a rich library of functions, each serving a specific purpose. Here are some essential functions and techniques that empower you to manipulate data, create dynamic calculations, and craft informative Power BI reports:
- Logical functions
- Text functions
- Date and time functions
- Mathematical & trigonometric functions
- Information functions
- Other functions
Logical Functions
Logical functions in DAX are fundamental tools for creating conditional statements that enable dynamic and responsive data analysis. Here’s a detailed look at how to use the AND and IF functions in DAX.
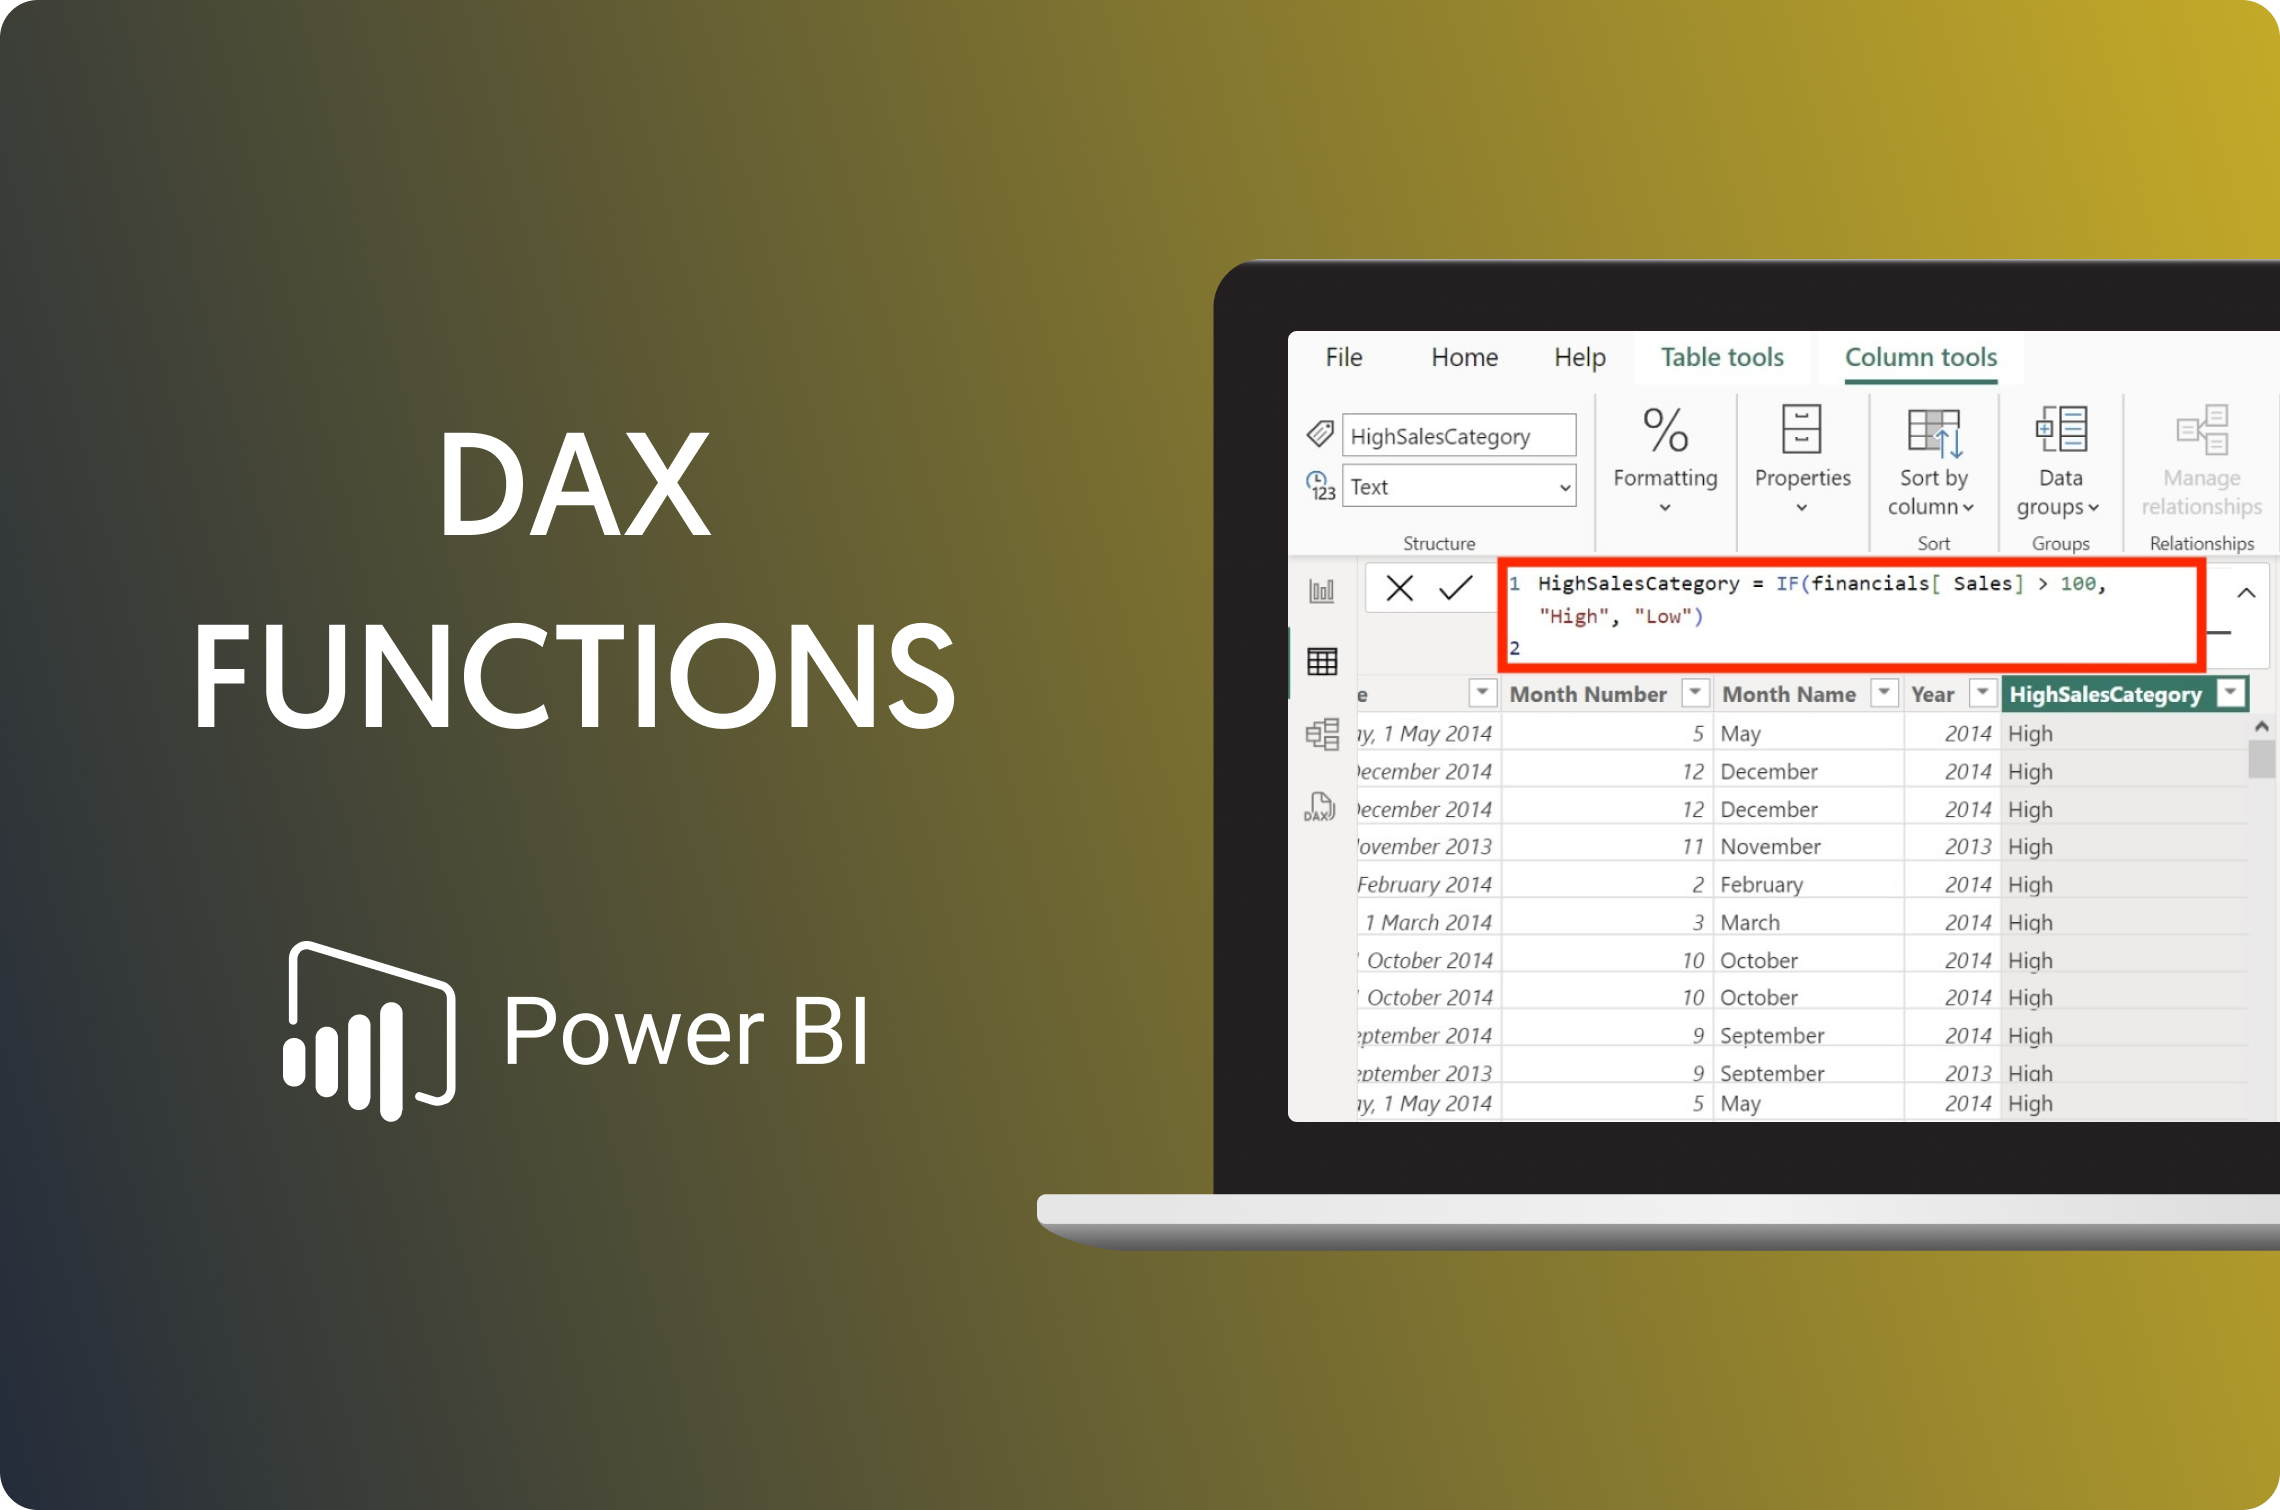
1. IF
The IF function allows you to create conditional statements with specific outputs based on whether a condition is TRUE or FALSE.
Syntax:
IF(<logical_expression>, <value_if_true>, <value_if_false>)
Example:
HighSalesCategory = IF(financials[ Sales] >100, "High", "Low")

2. AND
Let’s say you want to identify customers who purchased between a specific date range and spent more than a certain amount. The AND function allows you to combine multiple conditions and only return TRUE if all conditions are met.
Syntax:
AND(<logical_expression1>, <logical_expression2>, ...)
Example:
HighSalesANDProfit = IF(AND(financials[ Sales] > 100, Financials[Profit] > 50000), "High Sales and Profit", "Other")

Other logical functions include:
Text Functions
Text functions in DAX are useful for manipulating text data to enhance your analysis. Let's explore some essential text functions that empower you to clean, combine, and extract specific information from your text fields.
1. CONCATENATE
If you have separate columns for first and last names but need a single "Full Name" column. CONCATENATE allows you to merge text strings from multiple columns into a single string.
Syntax:
CONCATENATE(<text1>, <text2>, ...)
Example:
Product Segment = CONCATENATE(Financials[Product],financials[Segment])

2. LEFT
Sometimes, you only need a specific portion of a text string. The LEFT function extracts a specified number of characters from the beginning of a text string.
Syntax:
LEFT(<text_string>, <number_of_characters>)
Example:
Product Initial = LEFT(Financials[Product], 1)

Other Text functions include:
Date and Time Functions
Date and time functions help you navigate your data and uncover trends and patterns.
1. YearThe YEAR function is used to return the year of a date. It takes a date as an argument and returns the year as a four-digit integer.
Syntax:
YEAR(<date_expression>)
Example:
_YEAR = YEAR(Financials[Date])

2. DATE
This function allows you to construct a date value from individual components (year, month, day). It is particularly useful when creating custom dates based on calculations or logic.
Syntax:
DATE(<year>, <month>, <day>)
Example: Here’s an example of the YEAR to DATE Function.
Sales YTD = CALCULATE(

    SUM(financials[ Sales]),

    DATESYTD(Financials[Date])

Other date and time functions include:
Mathematical & Trigonometric Functions
Mathematical and trigonometric functions in DAX are essential for performing complex numerical calculations and analysis. These functions provide advanced capabilities for quantitative insights, enabling users to solve mathematical problems directly within their data models.
1. CEILING
CEILING rounds a number up to the nearest integer, which can be useful when defining thresholds or working with fiscal quarters.
Syntax:
CEILING(<number>, <significance>)
Example:
Rounded Sales = CEILING(financials[ Sales], 1000)

Other mathematical & trigonometric functions include:
Information Functions
Information functions in DAX are crucial for retrieving metadata, evaluating conditions, and managing data integrity. These functions don't perform calculations but provide insights about the data or the context in which your formula is being evaluated.
1. CONTAIN
This function checks if a string contains another substring, but it must be used with caution. While it can be handy for simple filtering, it can become slow with large datasets.
Syntax:
CONTAINS(<text_string>, <search_string>)
Example:
ContainsVTT = CONTAINS(Financials, Financials[Product], "VTT")

2. ISBLANK
An instance where you have a column with some missing values. ISBLANK helps identify blank cells, allowing you to handle them appropriately within your calculations.
Syntax:
ISBLANK(<expression>)
Example:
IsDiscountsBlank = ISBLANK(Financials[Discounts])

Other information functions include:
Other Functions
Besides the common DAX functions, several advanced functions provide powerful capabilities for creating and managing data, handling errors, and performing complex aggregations and calculations. Here are three functions that come under the ‘Other Functions category in DAX:
1. SUMMARIZECOLUMNS
The SUMMARIZECOLUMNS function returns a summary table for the requested totals over a set of groups, allowing you to perform complex aggregations.
Syntax:
SUMMARIZECOLUMNS(GroupBy_ColumnName, [GroupBy_ColumnName2, ...], Name, Expression, [Name2, Expression2, ...])
Example:
SUMMARIZECOLUMNS(
    financials[Sale Price],
    “Total Sales”, SUM(financials[ Sales])

2. ERROR
The ERROR function returns an error message, which can be used to debug or handle unexpected scenarios in your calculations.
Syntax:
ERROR("Error Message")
Example:
CheckSales = IF(financials[ Sales] < 1000, ERROR("Sales below threshold!"), financials[ Sales])

3. DATATABLE
The DATATABLE function in DAX creates a table with predefined columns and static data. This function is beneficial for embedding small tables directly within your DAX code for reference or lookup purposes.
Syntax:
DATATABLE(
    Column1Name, Column1Type, Column2Name, Column2Type, ...,
    {
       {Value1, Value2, ...},
       {Value1, Value2, ...},
    ...}
)
Example:
DATATABLE(
    "Category", STRING,
    "Amount", INTEGER,
    "Year", INTEGER,
    {
        { "Revenue", 10000, 2022 },
        { "Expenses", 7500, 2022 },
        { "Profit", 2500, 2022 }
    }
)

Below are the other important functions of DAX in Power BI:
- NATURALLEFTOUTERJOIN
- SELECTEDMEASUREFORMATSTRING
- EXCEPT
- GENERATESERIES
- GROUPBY
- INTERSECT
- UNION
- VAR
- ISEMPTY
- ISSELECTEDMEASURE
- NATURALINNERJOIN
Level up Your Power BI Game: Integrate All Your Data with Dataddo!
Dataddo is a no-code data integration platform that can reliably and automatically sync data from all your sources, in anaytics-ready format, to Power BI. It offers hundreds of pre-built connectors, and all integrations are proactively managed and monitored by our team, so that you'll never have to wake up to a broken dashboard again.
The platform offers inbuild tools for data quality control and blending, data security, and even data storage, so you don't need a data warehouse to use it!
If you follow the video tutorials at Dataddo Academy, you'll have your data flowing to Power BI in minutes.
Just sign up for a free Dataddo account if you don't have one.
Additional Power BI Tips, Tricks, and Resources
Continue reading the Dataddo blog for more Power BI tips, tricks, and resources!
- Smarter Financial Dashboards for SMEs (with Free Power BI Template)
- Guide to Slicers in Power BI: Create Better-Looking Reports
- Overcome Data Blending Limitations of Tableau, Looker, Power BI
- How to Connect NetSuite to Power BI: ODBC vs. Dataddo
- How to Connect Google Sheets with Power BI: Direct vs. Dataddo
- How to Connect Sage Accounting to Power BI for FREE: Direct vs. Dataddo
- How to Connect Google Analytics to Power BI for FREE: Direct vs. Dataddo
- How to connect JSON with Power BI: Direct vs. Dataddo
- How to Connect SEMrush to Power BI for FREE
- How to Connect Xero to Power BI With Dataddo for Free
- Connecting Xero to Power BI: Native or Third-Party Connector?
- How to Integrate Exact Online Data with Power BI (or any BI Tool)
- Power BI vs Tableau: The Breakdown
|
Connect All Your Data with Dataddo Just a few quick steps to get your data to Power BI.
|


Comments