
Power BI is a powerhouse for analyzing and visualizing data. One of the features it offers is Power Query, which allows users to import, transform, and consolidate data from various sources into a more usable state. It can be accessed through the Power Query Editor, a graphical user interface, or Power Query M, a functional programming language.
This article will focus on how to use Power Query M.
Click to skip down to a specific section:
- What is M code?
- M code setup
- Power Query M functions: Key points
- Why use Dataddo to get your data to Power BI?
- Additional Power BI tips and tricks
What is M Code?
M code is a mashup language designed to create queries that combine data. It is similar to the F# programming language and is described by Microsoft as a "mostly pure, higher-order, dynamically typed, partially lazy, functional language." M is also case-sensitive, so, for example, words like Source and source are considered different.
M Code allows users to write custom scripts to modify and shape data, and offers automation and fine-grain control for data cleaning, restructuring, and consolidation. Let’s see its syntax.
Syntax
Here is how to say "hello world" in M code:
let // Start of the block |
- let: Starts a block to define variables and their values.
- Source: Variable holding the result of the following expression.
- Text.Proper("hello world"): Converts "hello world" to "Hello World".
- in: Specifies that Source is the final output of the query.
If this seems confusing, don't worry. We will discuss examples below to help you grasp M code.
M Code Setup
You can view M code in Power Query Editor by clicking Transform Data in the ribbon, which will open the editor.

M code will appear in the Formula Bar, as shown below:

You can also open the Advanced Editor window to view it.

Now, let’s build some understanding of Power Query M functions.
Power Query M Functions: Key Points
It's impossible to cover all of Power BI's Power Query M functions in this article, but the selection below will give you a good taste of how they work.
Custom Functions
Power Query M lets you define custom functions to bundle and reuse specific data transformation steps. These functions can be written within a query or in separate modules.
The function's body comes after the => symbol, and you can optionally specify type information for parameters and the return value. Functions are defined and called within the body of a ‘let’ statement. Let’s define a simple function that multiplies the input by 2.
let |
The output for the above function will be 4.
Built-in Functions
As stated above, a function maps input values to a single output. It's written by naming the parameters and providing an expression to compute the result. Here’s an example:
let |
Writing your functions can be tiresome; therefore, Power Query provides many built-in functions, and here’s a complete list. Here’s an example of two built-in functions:
let
|
Text.Proper(): Capitalizes the first letter of each word in the given text value.
Date.DayOfYear(): Returns the day of the year from the given date, datetime, or datetimezone value.
Here’s the result of the above query:

Function Libraries
Power Query M allows functions to be grouped into libraries or modules to enhance code organization and reusability. Libraries house collections of related functions that can be shared across various queries or workbooks.
Below is an example of a library of functions in M code.
library MyFunctions {
|
Now, let's look at advanced data transformations.
Advanced Data Transformations
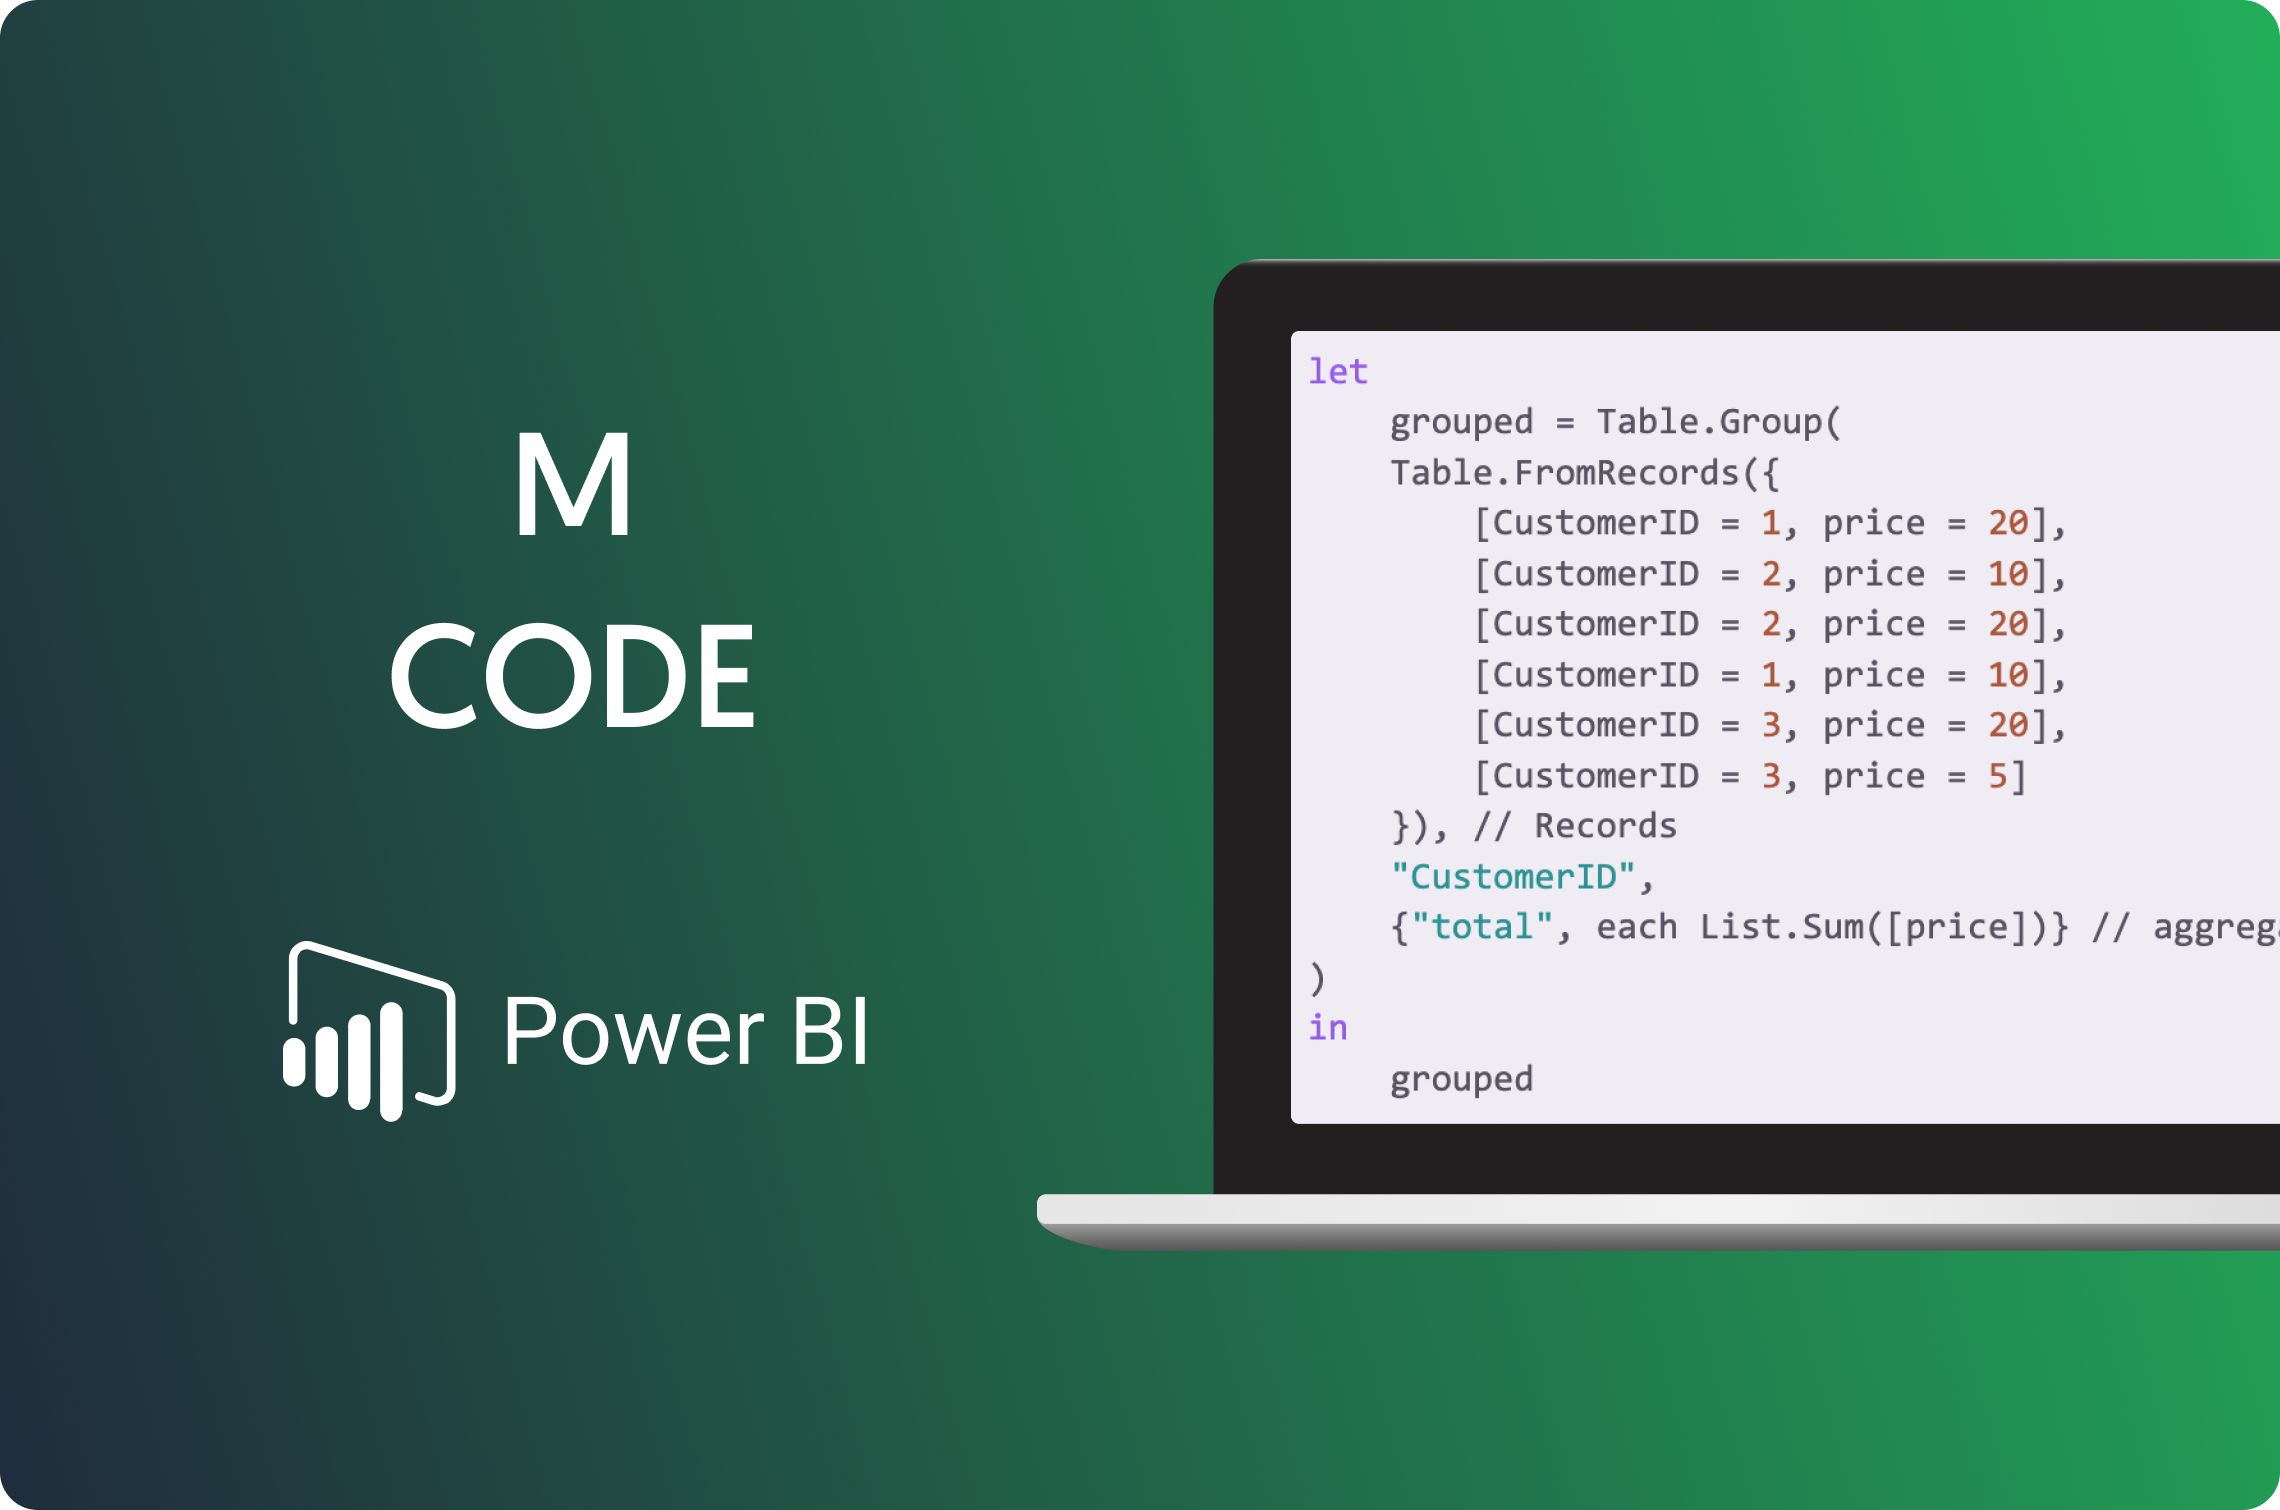
Power Query M supports advanced data transformation techniques, including grouping, aggregation, pivoting, unpivoting, merging, appending tables, and handling errors. These features allow effective shaping and cleaning of data from various sources. Here is an example of advanced data transformation:
Table.Group(): Groups table rows by the key columns defined by key, which can be a single column name or a list of names. A record is created for each group with the key columns and any specified aggregated columns.
let |
Here is the result:

Query Dependencies
Power Query M functions can reference and use the output of other queries. This allows you to create a data transformation workflow in which queries build on the results of previous ones.
let |
Here, previousQuery is the dependent query used in the filtered result.
Query Folding
Query folding optimizes resource usage, such as CPU and memory, by minimizing data processing within Power BI. It improves performance by pushing data transformations back to the data source, reducing data transfer and the amount of data processed in Power BI. This can be achieved in two ways:
Query Folding with SQL Database
Power Query M functions can incorporate SQL statements directly within queries, allowing the database server to handle heavy processing and improve query performance.
let |
First, connect to the source and query the database. The query will run on the server, and the result will be fetched.
Query Folding with Filtered Rows
Power Query M functions support filter operations that can be pushed back to the data source. For instance, the data source can execute filtering rows based on a condition for more efficient data retrieval.
The following code extracts the contents of an Excel file and filters the rows where the value in the second column is 'Germany'.
let |
And that's M code in Power BI!
Why Use Dataddo to Get Your Data to Power BI?
Dataddo is a no-code data integration platform that can automate the flow of data from any SaaS app or database to Power BI.
Record Time to Insights
Easily connect services to Dataddo via a streamlined interface. Sync data as frequently as every 5 minutes. Then focus purely on deriving profitable insights from your data in Power BI.
No More Broken Dashboards
Dataddo's engineers proactively monitor and maintain all data connections, so that you never have to wake up to a broken Power BI dashboard in the morning.
Store Your Historical Data
You don't need to manage a dedicated database in order to collect and analyze data from periods past. You can use Dataddo's embedded SmartCache storage.
Comprehensive Data Quality Monitoring Tools
Filter, monitor, blend, and transform your data automatically in Dataddo, so that you can spend less time preparing it in Power BI for analysis.
 Dataddo's flow screen. Notice the red boxes—inside are the numbers of data sources combined in a single connection to Power BI.
All you have to do to get your data flowing is sign up for a free Dataddo account, then go to Dataddo Academy for simple video tutorials on how to set up your data connections.
Additional Power BI Tips, Tricks, and Resources
Continue reading the Dataddo blog for more Power BI tips, tricks, and resources!
- Mastering DAX Functions in Power BI
- Guide to Slicers in Power BI: Create Better-Looking Reports
- Smarter Financial Dashboards for SMEs (with Free Power BI Template)
- Overcome Data Blending Limitations of Tableau, Looker, Power BI
- How to Connect NetSuite to Power BI: ODBC vs. Dataddo
- How to Connect Google Sheets with Power BI: Direct vs. Dataddo
- How to Connect Sage Accounting to Power BI for FREE: Direct vs. Dataddo
- How to Connect Google Analytics to Power BI for FREE: Direct vs. Dataddo
- How to connect JSON with Power BI: Direct vs. Dataddo
- How to Connect SEMrush to Power BI for FREE
- Connecting Xero to Power BI: Native or Third-Party Connector?
- How to Integrate Exact Online Data with Power BI (or any BI Tool)
- Power BI vs Tableau: The Breakdown
|
Connect All Your Data with Dataddo Just a few quick steps to get your data to Power BI.
|


Comments