
Data analysts are an important part of modern business, and this article will not argue otherwise. But it will argue that not every company, department, and team needs one to become data-driven.
Before being hired as Senior Product Manager of data integration platform Dataddo, I had little experience working directly with data tools. But I knew I needed to learn if I wanted to keep the product competitive. So, I began using no- and low-code software to move, profile, and analyze data, without any real help from dedicated data personnel. Despite a rocky start, I am now one of our company’s citizen data scientists, and am teaching people in my team and other teams how to work with data and analytics.
In the text that follows, I will help businesses that want to become more data-driven decide if they should hire a dedicated data analyst, and, for those that decide not to, talk about the stages they should go through on their journey towards data-driven decision-making.
What It Really Means to Hire a Data Analyst
By itself, hiring a data analyst is not enough to make a company, department, or team data-driven.
Why not? There is a growing body of evidence suggesting that the greatest determinant of successful implementation of data and analytics initiatives is company culture (NewVantage Partners, Gartner, Accenture).
This makes sense, because dedicated data personnel don’t act alone with their data; they have to integrate it and share it with business teams, who themselves need to become data literate in order to draw proper conclusions from the data. The latter process is the real challenge.
But, there’s another important consideration: business teams can’t be data literate if they are working with unreliable data. And this points to one of the core competencies of data analysts—to ensure that business teams are consuming clean and reliable data.
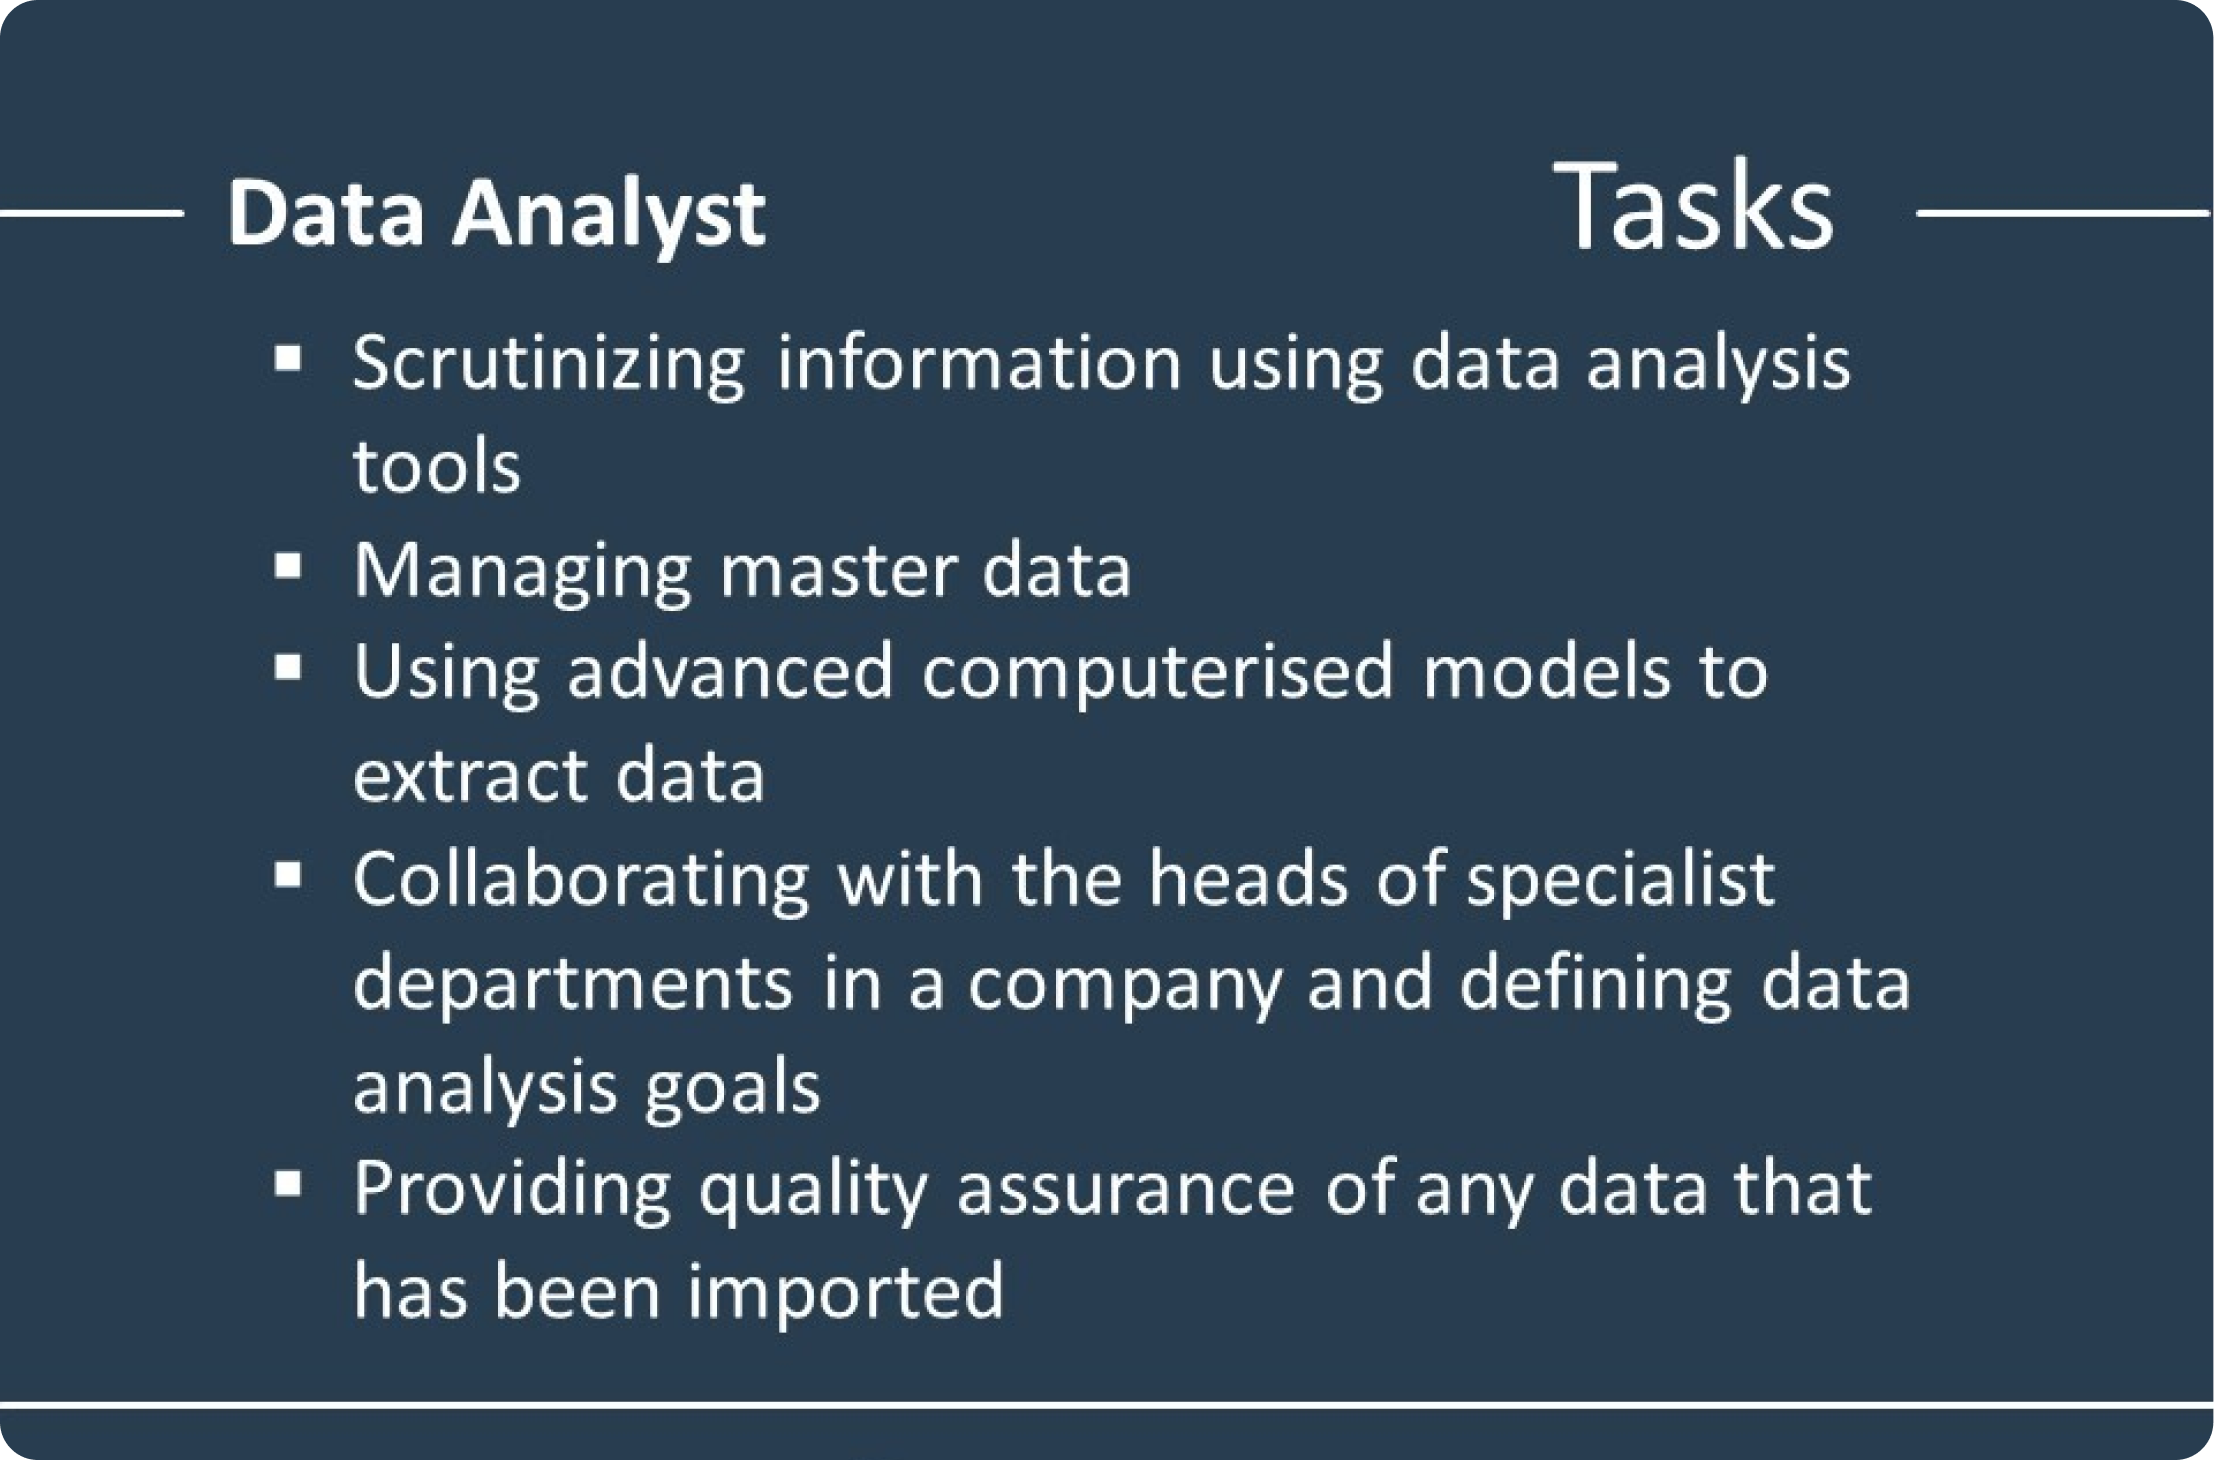 Source: Freelancermap
Certainly, data can be made clean and reliable without the help of data analysts, but the process of doing so will take longer, and this should be a key consideration when deciding whether to hire.
So, should your company hire a data analyst?
Larger companies with bigger budgets will most likely say “yes.” But smaller companies often don’t have the budget. These companies might be tempted to hire a contractor or agency to kickstart adoption of data and analytics, but I would argue that it’s better to start from within.
Why? Because agencies and contractors can themselves become silos of data skills. And siloed data skills are just as big of a problem as siloed data itself. Teams that don’t rely heavily on external data personnel will, in the end, have a lot more analytics flexibility for much faster decision-making.
The Stages of Becoming Data-Driven (without a Data Analyst)
Before we dive in, I’d like to make two quick notes.
Note one: The specifics of the stages outlined below will vary immensely from company to company, so the purpose of this section is to give you ideas about how to proceed, and help you manage expectations along the way.
Note two: If you’re a company owner or high-level manager, it’s ideal that you lead this initiative, because—as mentioned earlier—becoming data-driven means making data a part of company culture. If you don’t have the capacity to lead the initiative, it’s important that you find willing adopters in the relevant departments or teams. “Willing” is the key word here—a recent survey by NetSuite found that 95% of employees feel overwhelmed when working with data!
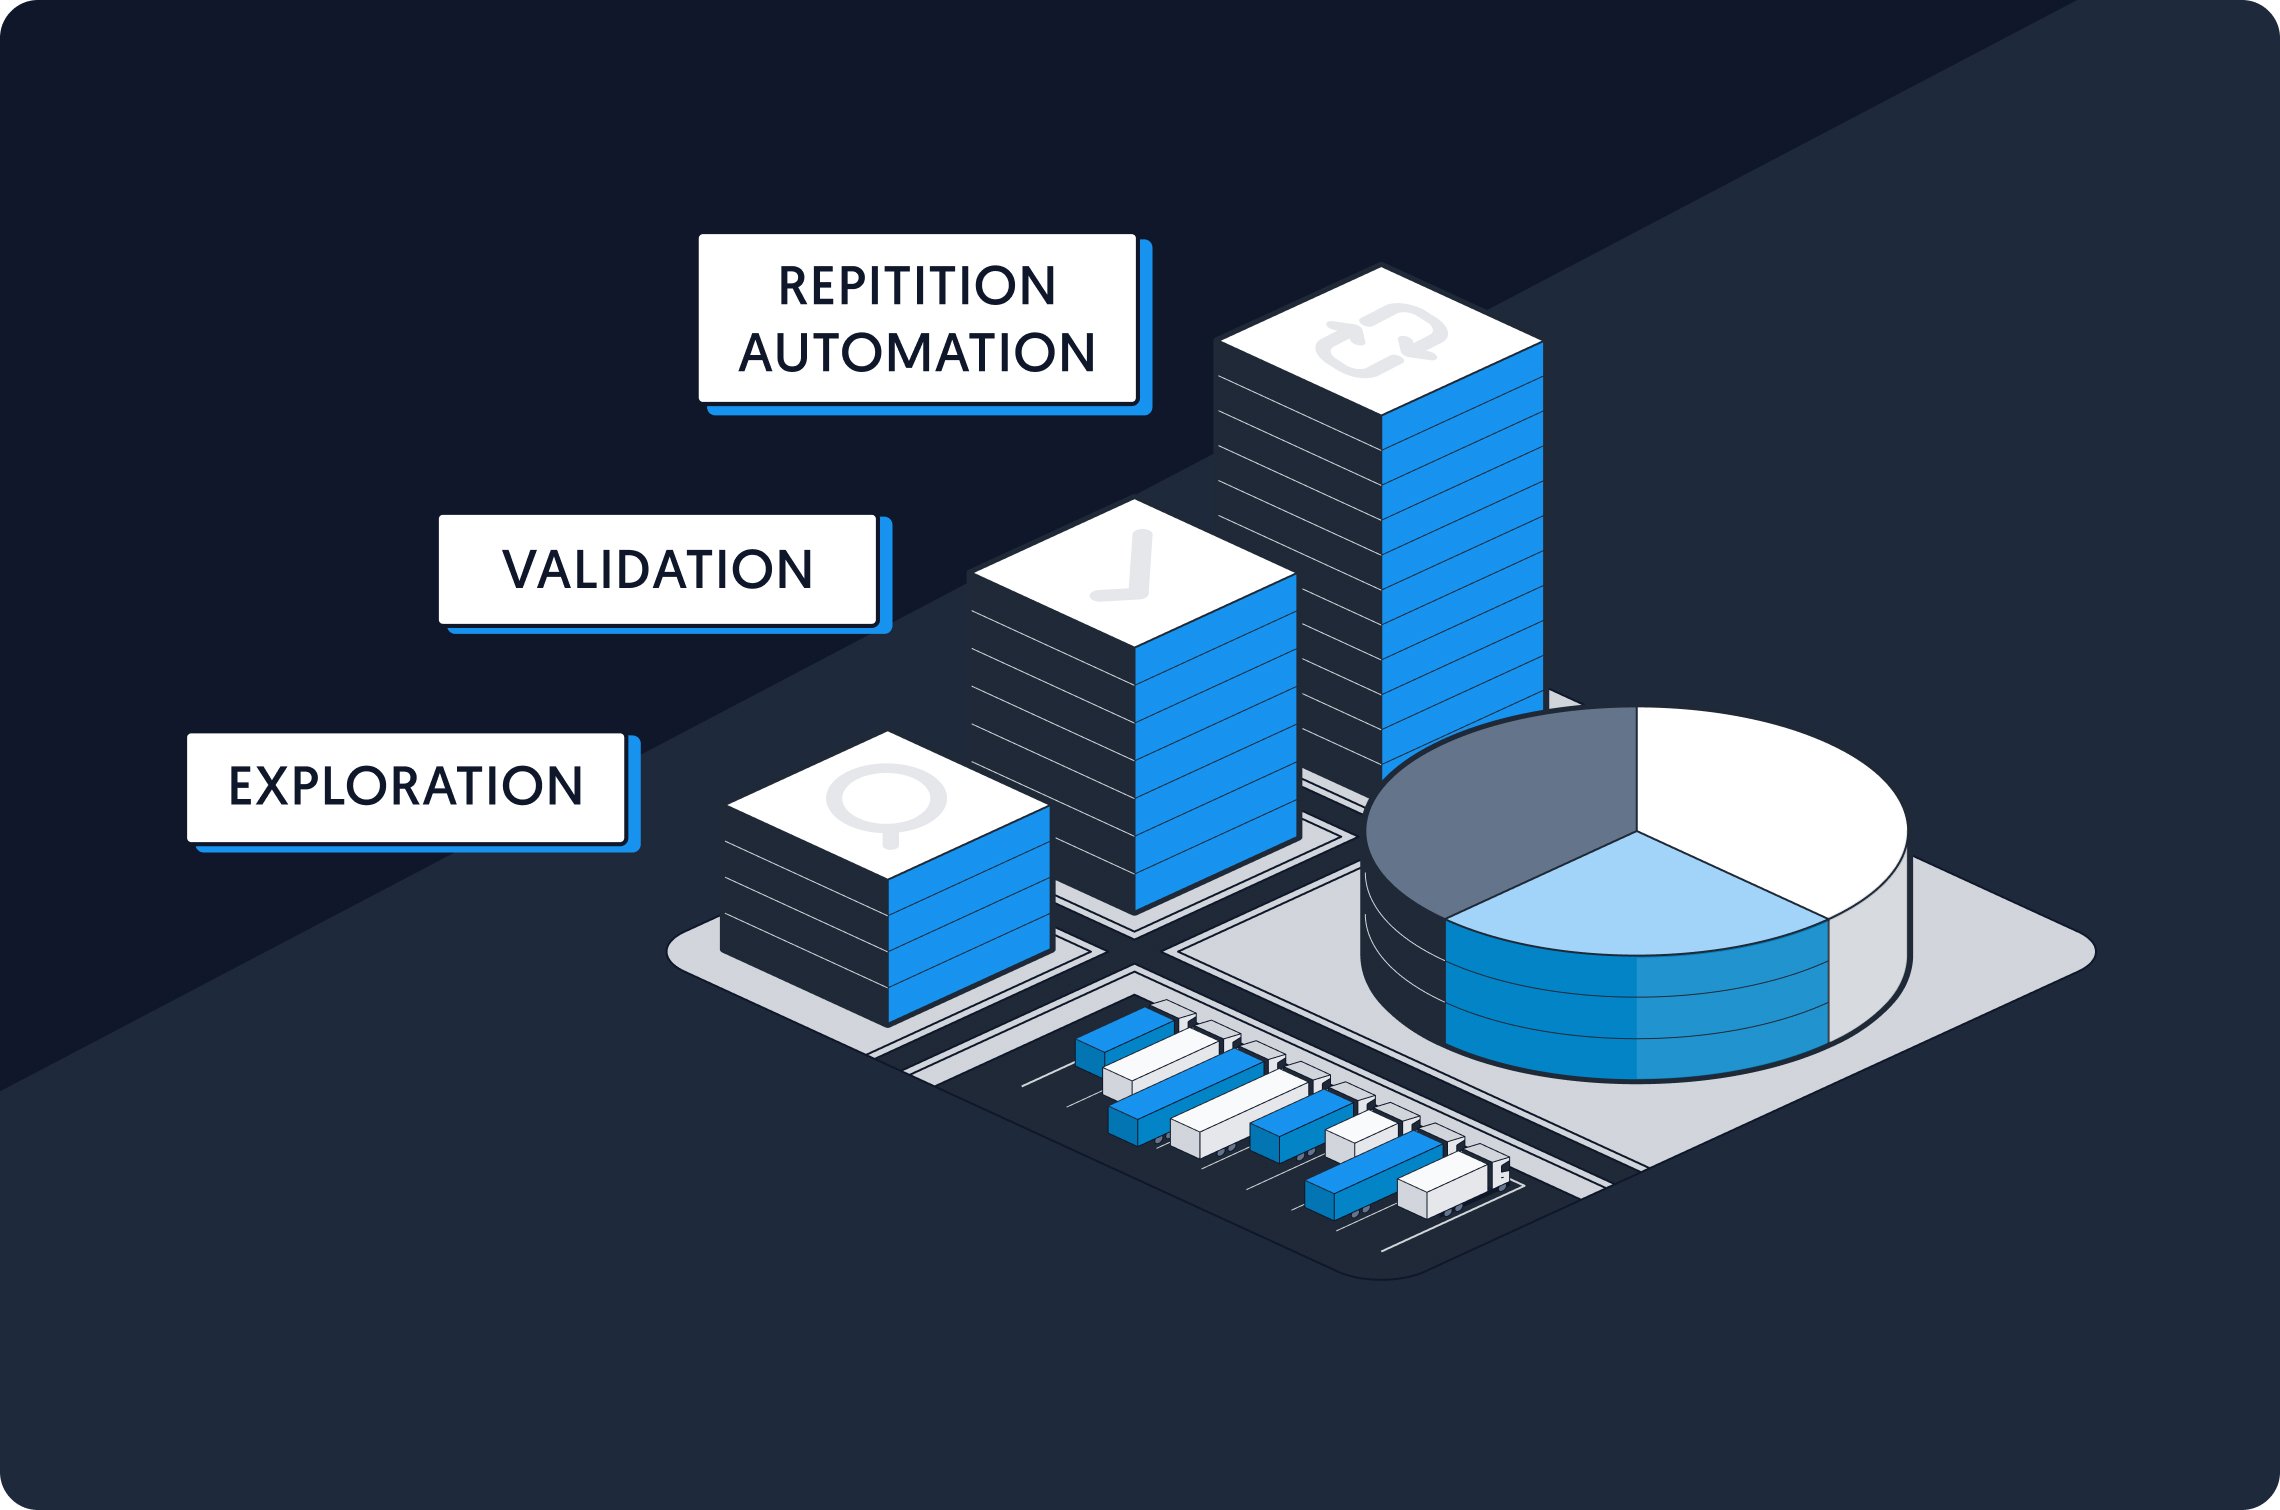
Stage One: Exploration
The first step is to ask business questions that can be answered with data; ideally, simple ones. Then, determine where the data needed to answer them might reside.
For example, if you ask “What improvements could we make to our homepage to reduce the bounce rate?” you’ll likely find the data in Google Analytics (GA). If you ask “What kinds of leads are generating the most revenue?” you’ll want to look to your CRM; in order to get the full picture in this case, you’d first have to make sure your CRM is tracking data from your website.
Next, you and/or your adopter(s) should start experimenting with different ways of visualizing the data. Visualization is extremely important, because data only tells a story when it’s organized and easy to consume.
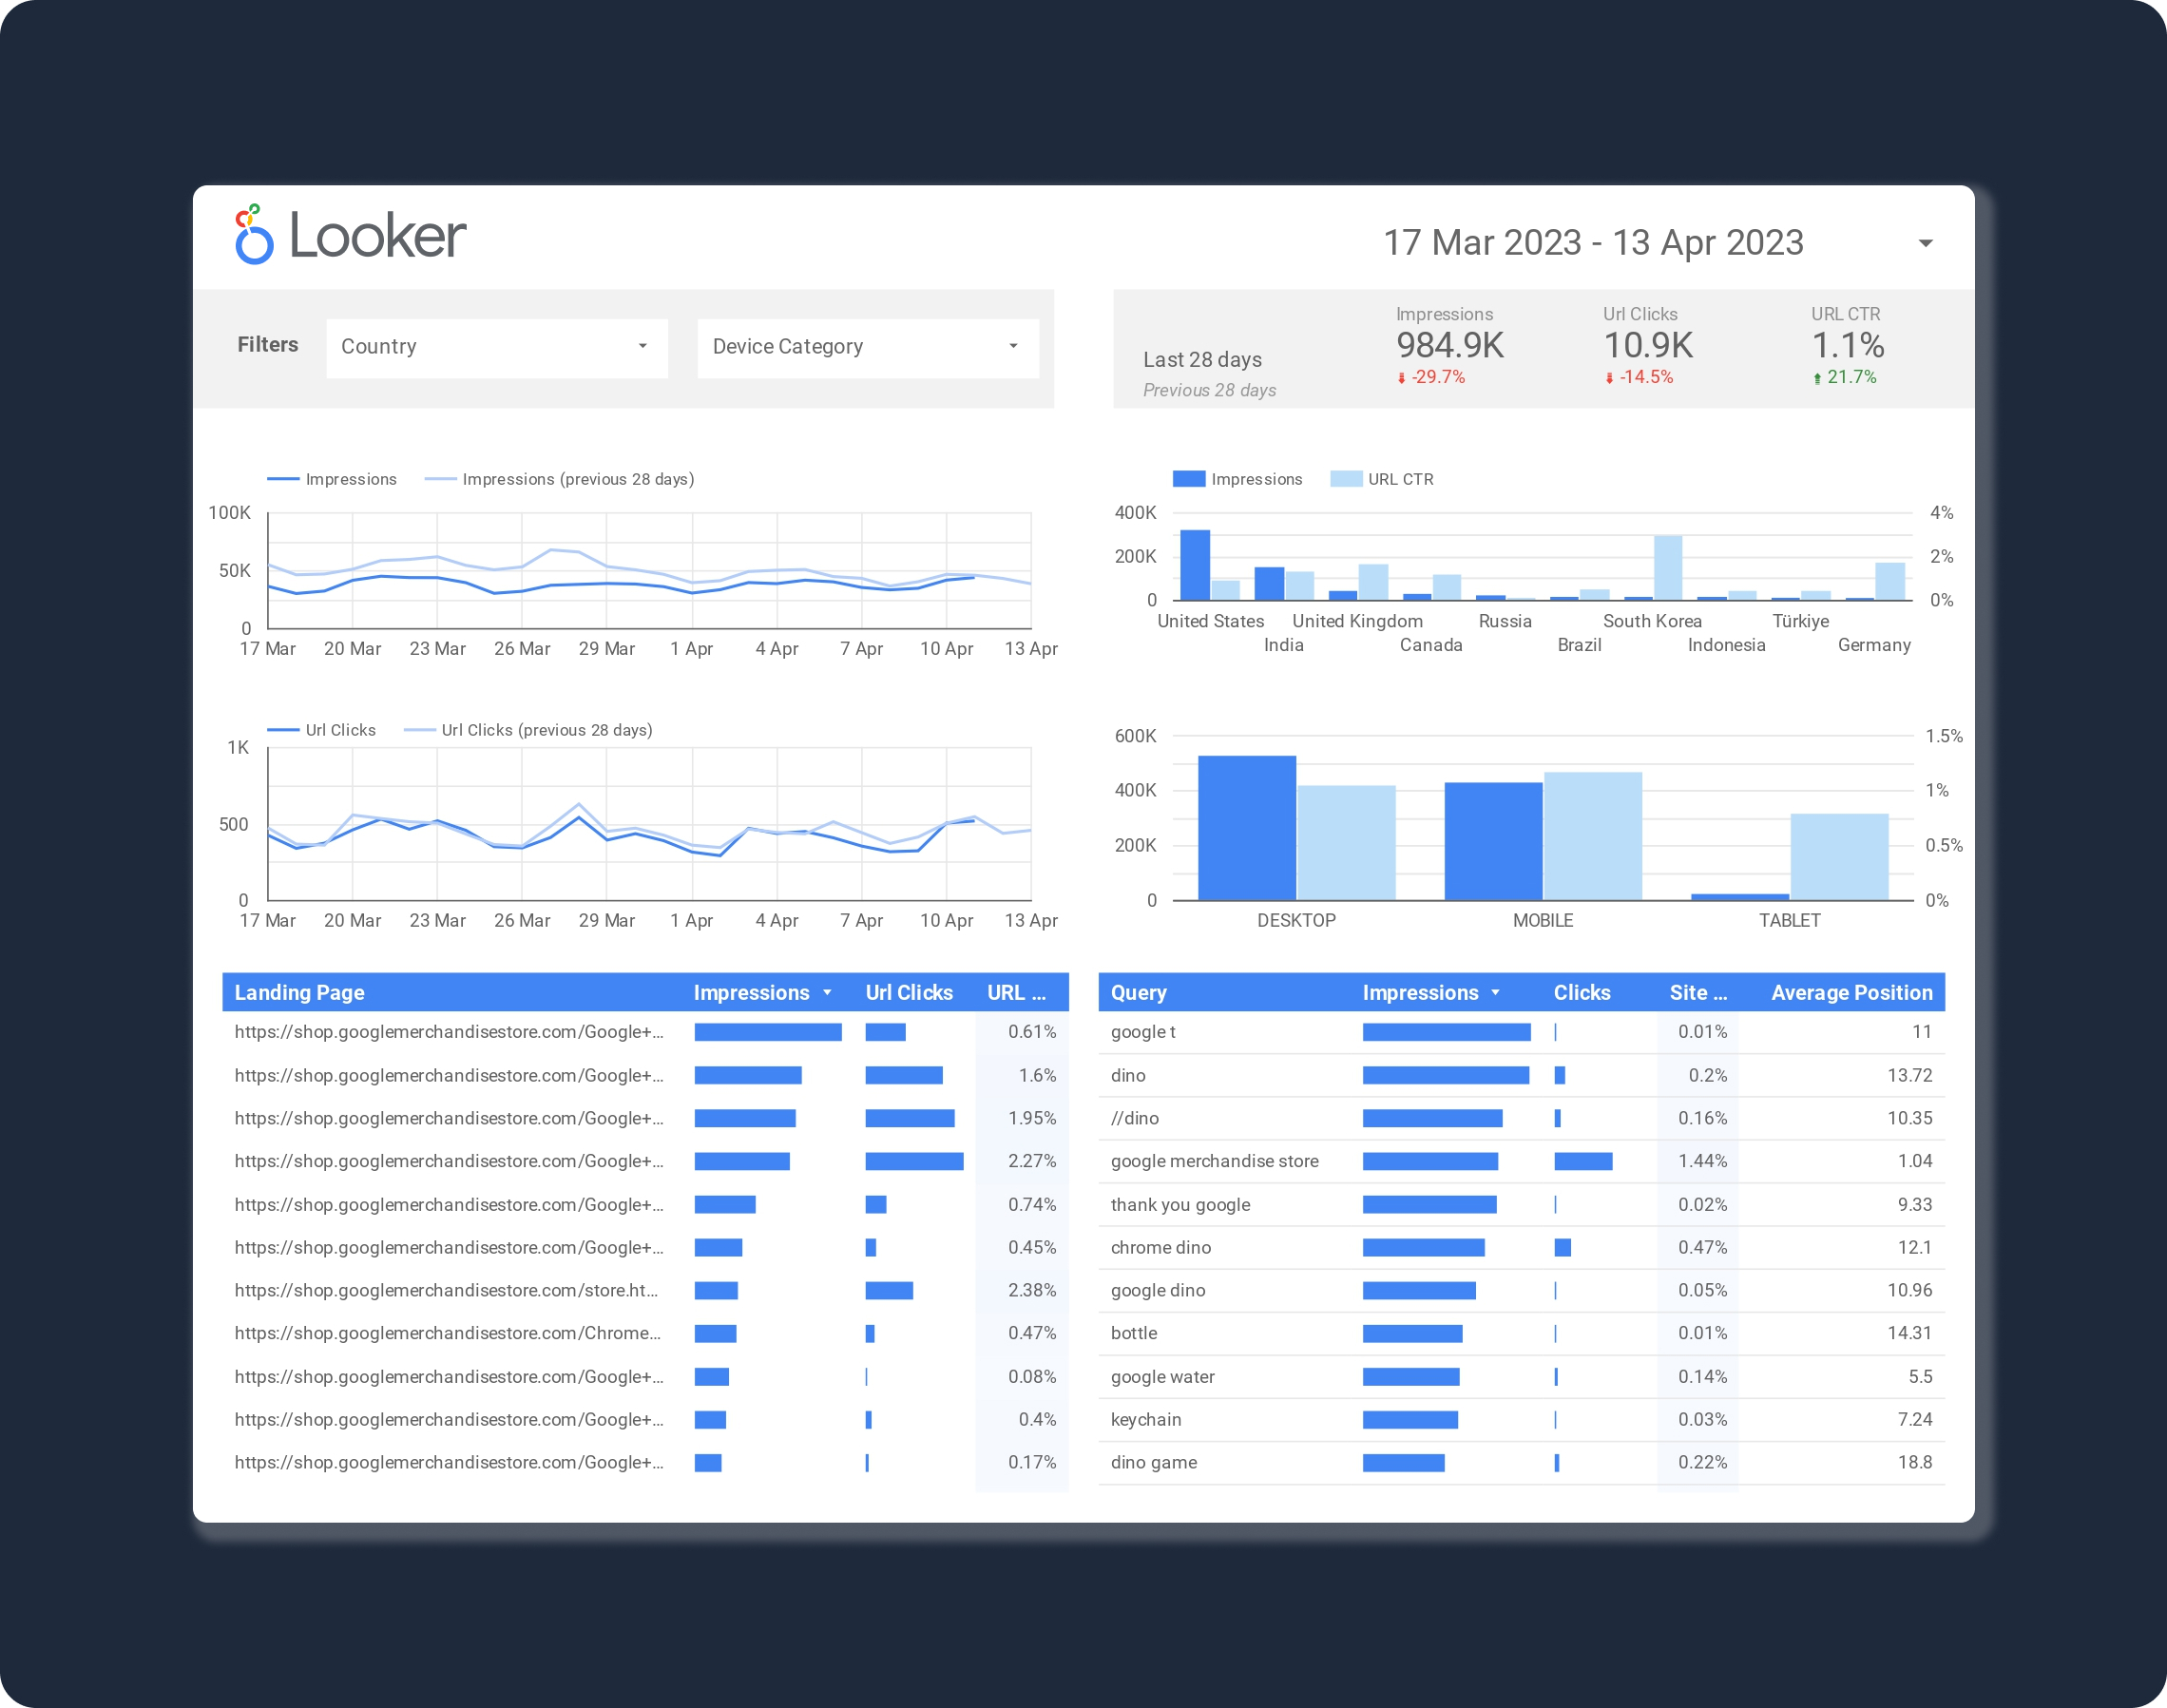 Source: Looker template
How best to visualize it? At this stage, one of two methods should work.
- Method one: If the tool that has the data you need offers user-friendly visualization functionality, use it! CRMs, for example, tend to be in this category.
- Method two: If the tool in question doesn’t offer user-friendly visualization functionality (I would put GA in this category), it’s fairly practical to manually export data (e.g., via CSV files), and upload it to Google Sheets or Looker Studio. These tools are generally good for data exploration, because they’re free and offer lots of options for grouping, transformation, and filtering. And since you’re still only trying to track basic metrics, there’s probably a template out there for you.
To help you along your way, here are some data visualization tips.
Once you’ve gained an understanding of how to manipulate your data, you will start connecting the dots.
Keep in mind that this could take weeks or even months, so if it’s not you (an owner or high-level manager) that’s doing the exploration, be sure to allow your adopters enough time and space to get familiar with the visualization tool and the data.
Arguably, this stage is the “hard part,” and business professionals who want to become data literate will need to go through it regardless of whether there’s an analyst around to help.
Stage Two: Validation
Now, you’ve got a dashboard that seems to answer your questions, but how do you know you can believe it? There are two ways to find out, and best practice is to use both.
(This, by the way, is the stage where an analyst would save the most time.)
Validate Your Dashboard with a Friend/Colleague/Consultant
One interesting thing I’ve noticed throughout my career is that when decision-makers are looking at dashboards, they seldom question how reliable the data is. All too often, the answer is “not very”—in Europe, for instance, unreliable data inhibits decision-making in 95% of organizations.
So, share the dashboard with colleagues and let them ask how you collected the data, how you computed the metrics, and how you arrived at your conclusions. Do they agree with your logic and methods? If they have their own dashboards, compare yours with theirs.
If you don’t have anyone else at your work to consult, ask a data-savvy friend. Or, simply contact an external data analyst for a one-off consultation—sometimes that’s all you need!
Validate Your Dashboard Using Data from Another Source
If you’ve been collecting your data from a single source, try collecting the same or similar data from another source to see if the numbers match.
For example, if you’ve been working with GA data to track behavior on your website, try comparing it with your backend data. If things don’t match, you might need to reconfigure how GA collects data (for this, use Google Tag Manager).
If you want to find out what kind of leads are generating the most revenue, check the data stored in your payment gateway. Again, if things don’t match, you might need to revisualize your data, or reconfigure how your CRM collects it.
If you don’t have access to or can’t find other data to compare your data with, try getting validation from experts in an online community.
Reddit could be a good place to start (for example, r/dataisbeautiful or r/datascience). You could also try the forums at Stack Overflow or Kaggle, but these tend to be on the more technical side. If you are working with sensitive or confidential data, be careful what you share!
 Source: Looker template
During this stage, you will likely discover some discrepancies, because people tend to collect, visualize, and interpret data differently. At my company, I was one of multiple adopters, and by comparing my dashboards with theirs, I learned that we were computing the same metrics differently! So, we made some adjustments, and when our dashboards started to match, we knew that we could trust them.
Stage Three: Repetition, Automation, Education
Once you’ve demonstrated value with simple data projects, repeat the process with progressively bigger projects.
Sooner or later, this will involve blending data from multiple sources, doing more advanced computations, and storing up historical data to get a picture of your business over time. If you’re still doing manual data export and import, you’ll quickly find these processes to be unsustainably time-consuming and prone to human error.
So, at this stage, best practice is to automate the synchronization of data from your sources to a dedicated business intelligence tool, or, if your company has in-house data engineers, to a data warehouse, data lake, or data lakehouse.
(By the way, now would be a great time to implement a data governance policy, if your company doesn't have one already.)

If your company doesn’t have in-house data engineers to automate integrations, you can easily build connections (or pipelines) using a no-code data integration platform. If your company does have engineers, a no-code integration platform is still recommended, because it will enable non-technical professionals to access data independently for quick insights, and save work for the engineers. It can even be used to feed first-party data directly into operational tools (like CRMs) via a process called reverse ETL.
Many of the most popular vendors of such platforms offer a free version that can get you started.
Now, your original adopters should be competent to start teaching others in their teams how to work with data, which is exactly what happens in organizations that are truly data-driven.
Analyst or No Analyst, Culture Is King
Once you’ve gone through the stages outlined above—which, in my case, took about six months—there is still a good chance that you will want to hire a data analyst. But, at that point, it will be much easier for the analyst to support your business teams, because you will have achieved the primary condition for data-driven decision-making: a conducive company culture.
*This article was originally published at Dataversity.net.
|
Connect All Your Data with Dataddo Just a few quick steps to get your data to your dashboard for better analysis, without the hassle.
|


Comments