
When you hear the term “data integration,” what emotion do you feel?
Probably none.
The term is not as exciting as buzzwords like “business intelligence,” “data-drivenness,” or “real-time analytics.” But data integration is a key enabler of all of these things.
As early as the beginning of 2020, data integration was a priority for more than 80% of business operations leaders. Today, it should be a priority not just for leaders, but for any professional that wants to convert data into profitable actions.
In this article, we’re going to talk about:
- What data integration is
- How to start integrating your data
- How data integration tools make data profitable
- Types of data integration
Let’s dive in.
What Is Data Integration?
You probably work for or own a small business, and you probably use marketing platforms, social media platforms, and other tools that help your business run.
Each tool generates data, and most of them have some kind of inbuilt analytics functionality, which is fine for starters. Sooner or later, however, you’ll want to combine the data from these tools and visualize it in a more comprehensive way, as well as store it for future use.
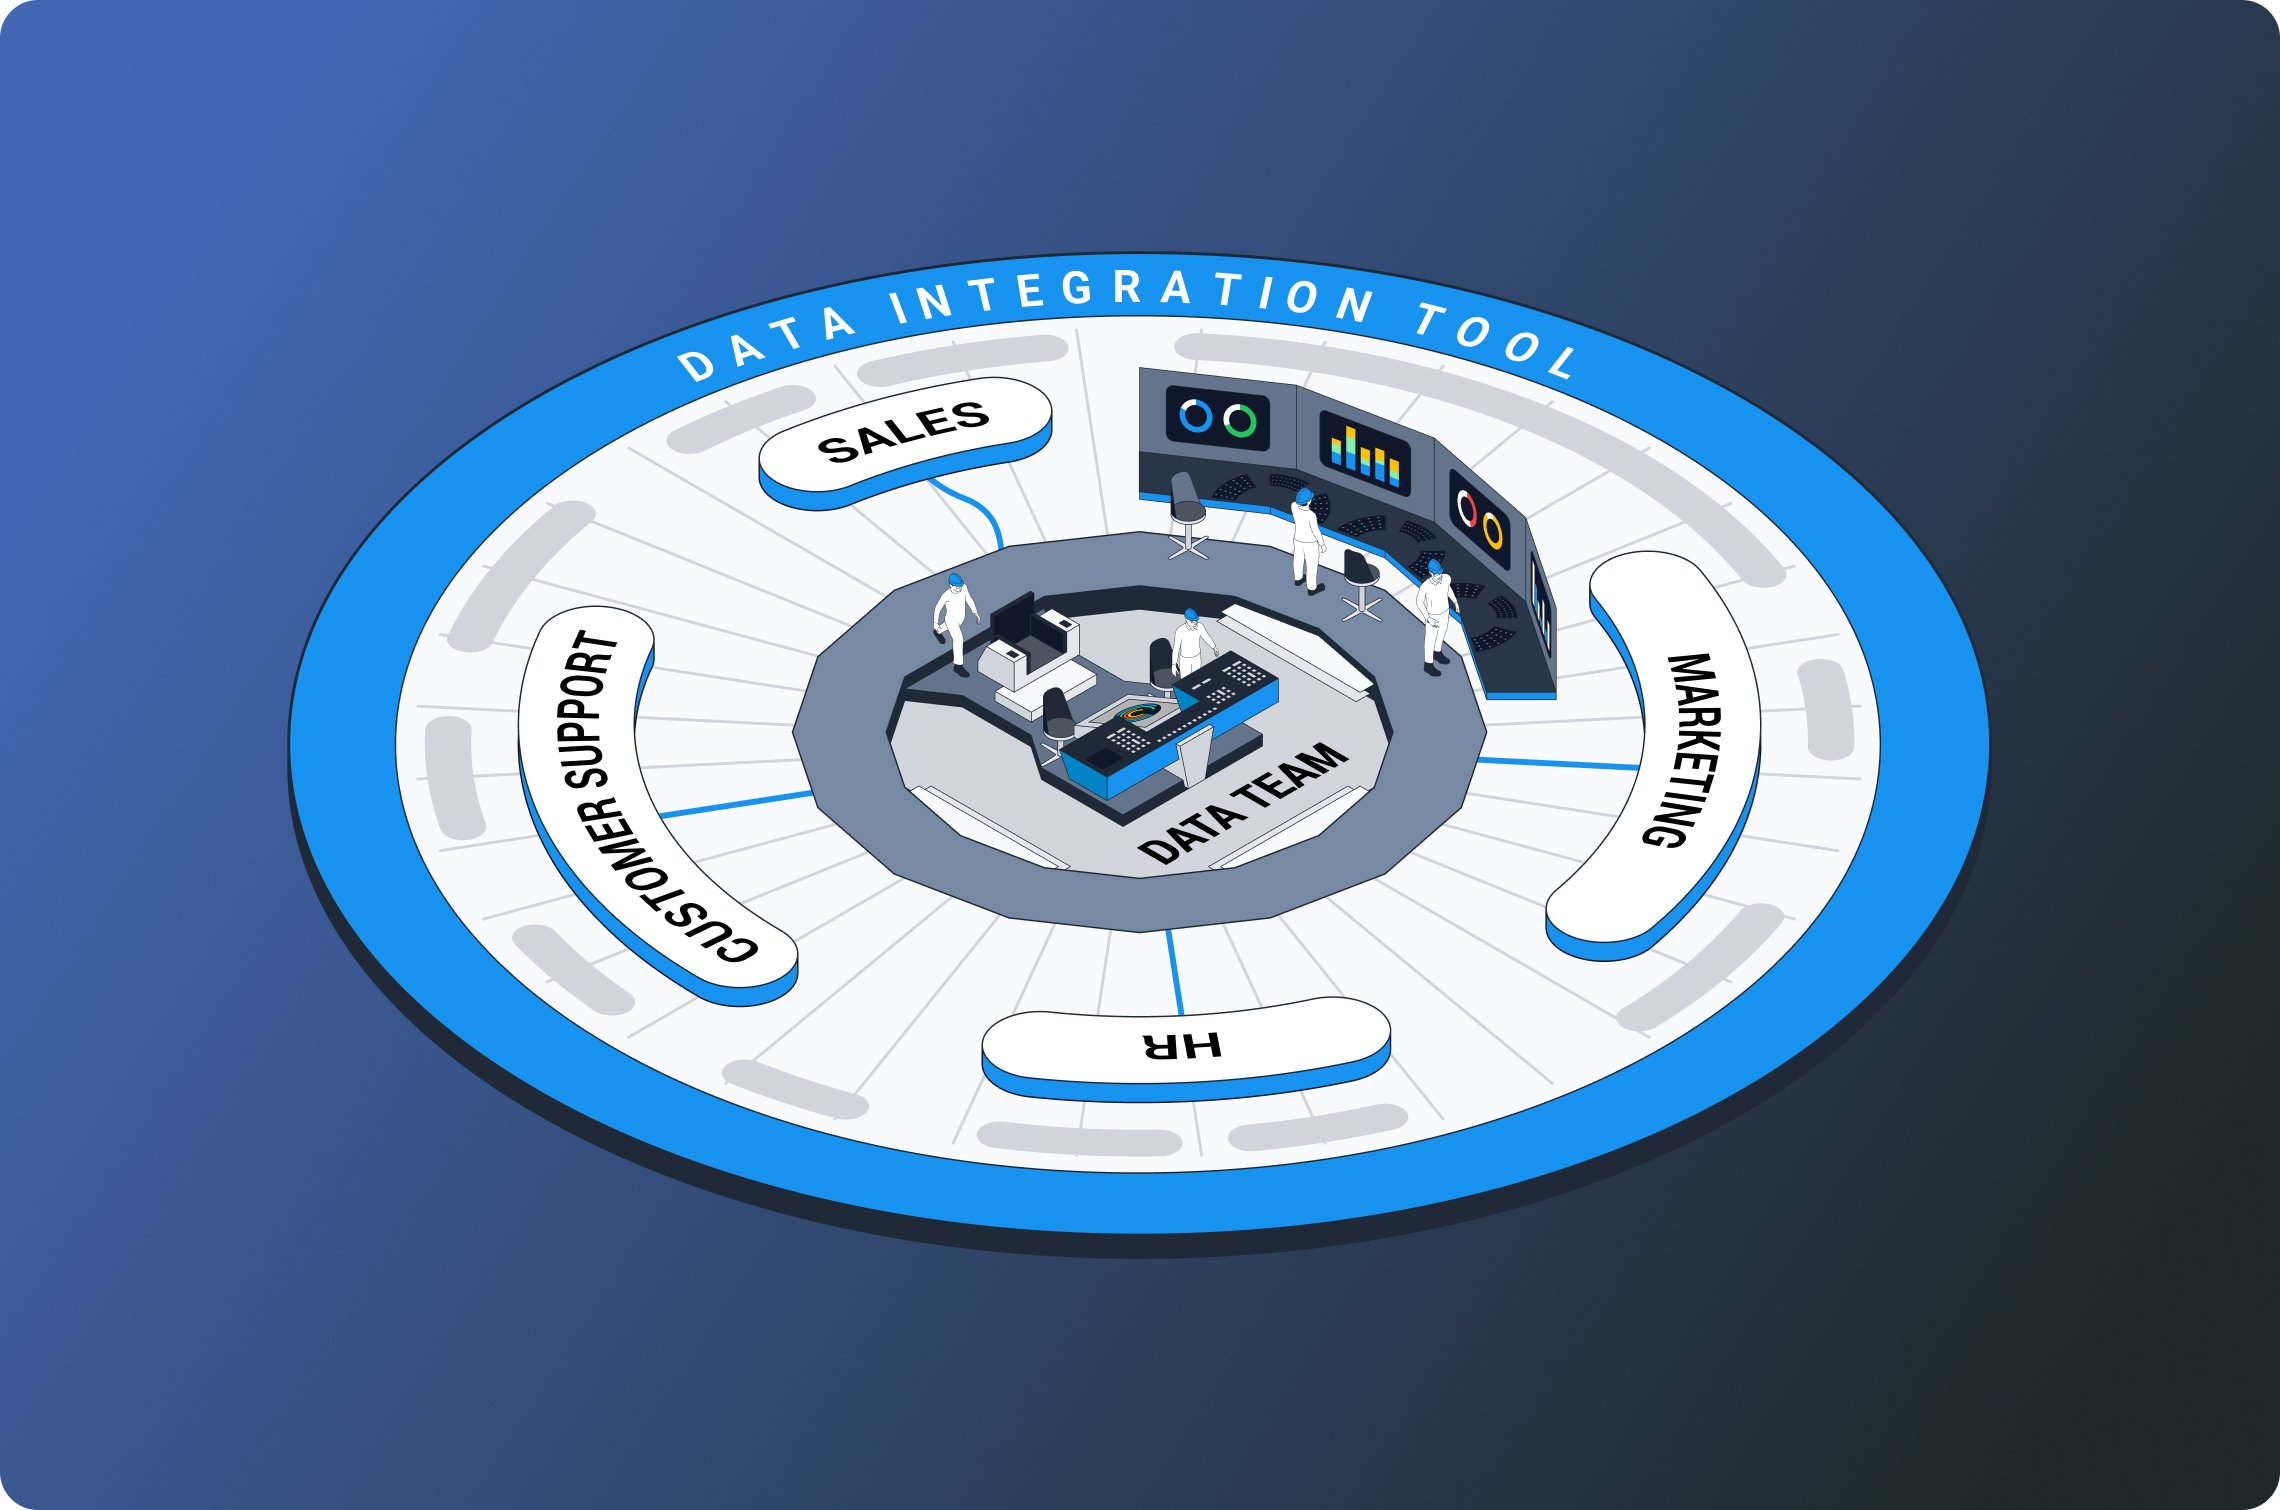
Data integration is the collection and combination of data from business tools, so that it can be used for analysis, record-keeping, and other operations that drive profits.
Fortunately, it’s not that hard to start integrating and deriving more value from your data.
How to Start Integrating Your Data
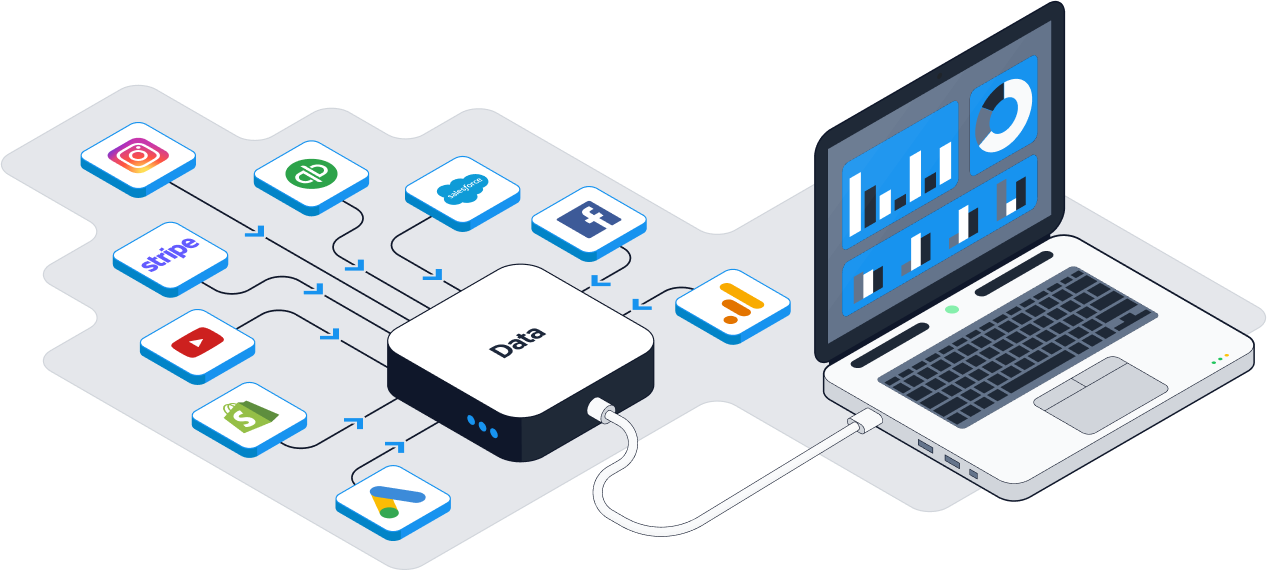
At the basic level, data integration is about combining your data in a dedicated visualization tool for more flexible analytics. You could combine, for example, Google Ads data with sales data to assess the return on investment of marketing campaigns.
But how to actually get the data from your business tools into a dedicated visualization tool?
If you’re just starting out and want to test integrating data from a few services, it may suffice to manually export CSV files from your business tools and import them into a visualization or dashboarding tool (here is our list of best visualization tools). But we can almost guarantee that this will soon become a cumbersome pain in the neck, because every time you want an updated snapshot of your data, you will have to put your hands to work.
And unless your data engineering team wants to build and maintain costly in-house integrations, you have only one other realistic option: use a data integration tool to automate connections between your business tools and a visualization tool. Don’t worry—this is not a sales pitch! It can be done for free.
Many no-code data integration tool vendors offer a free plan for starters, so we can’t think of a good reason why you wouldn’t use one of these. Dataddo, for example, is easy to use, and offers a forever-free plan and full learning academy that will help you build your first integrations.
If you need help working with data in general (i.e., with isolated data sets in individual business tools), see our article on how to become data-driven without a data analyst.
How Do Data Integration Tools Help Make Data Profitable?
Data integration tools are a means to two profitable ends:
- They save time and money by automating integration processes already in place.
- They open doors to new possibilities by enabling additional integration processes.
Data Integration Tools Save Time and Money via Automation
We talked a bit about the first point in the previous section. If you’re integrating your data by manually exporting and importing it into a dedicated visualization tool, you’re wasting time and exposing yourself to the risk of manual integration errors. Such errors include, but are certainly not limited to:
- Mismatched formats. Data formats, for example, are different in different tools, and manually unifying them will be a Sisyphean task.
- Data duplication. It’ll be easy to accidentally import the same data multiple times and skew your numbers.
- Incorrect file handling. Accidentally overwriting, deleting, or misplacing important data files.
You get the point: Data integration tools save time by automating manual integrations, and they save money by preventing costly mistakes and making it easier to take smart business decisions.
Data Integration Tools Open New Possibilities for Growth
Regarding the second point, data integration tools should enable multiple integration types, and should therefore be capable of supporting organizations as they grow in data maturity. In other words, they should enable the movement of data across an organization, from any source to any destination, no matter where they sit in a composable data architecture.
Our case study on Livesport is a good example of a company that uses Dataddo to integrate data from end to end, and puts the cost savings into business intelligence.
See the section below for more information on the different integration types.
Additionally, data integration tools allow access to data points that are unavailable via the user interfaces of the business tool you use. Instagram’s user interface, for example, does now allow the “story views” metric to be exported; it can only be accessed via Instagram’s API, which a data integration tool can easily do.
Types of Data Integration
Below we will give an overview of three types of data integration, from basic to advanced. Future-proof data integration tools should enable all of them.
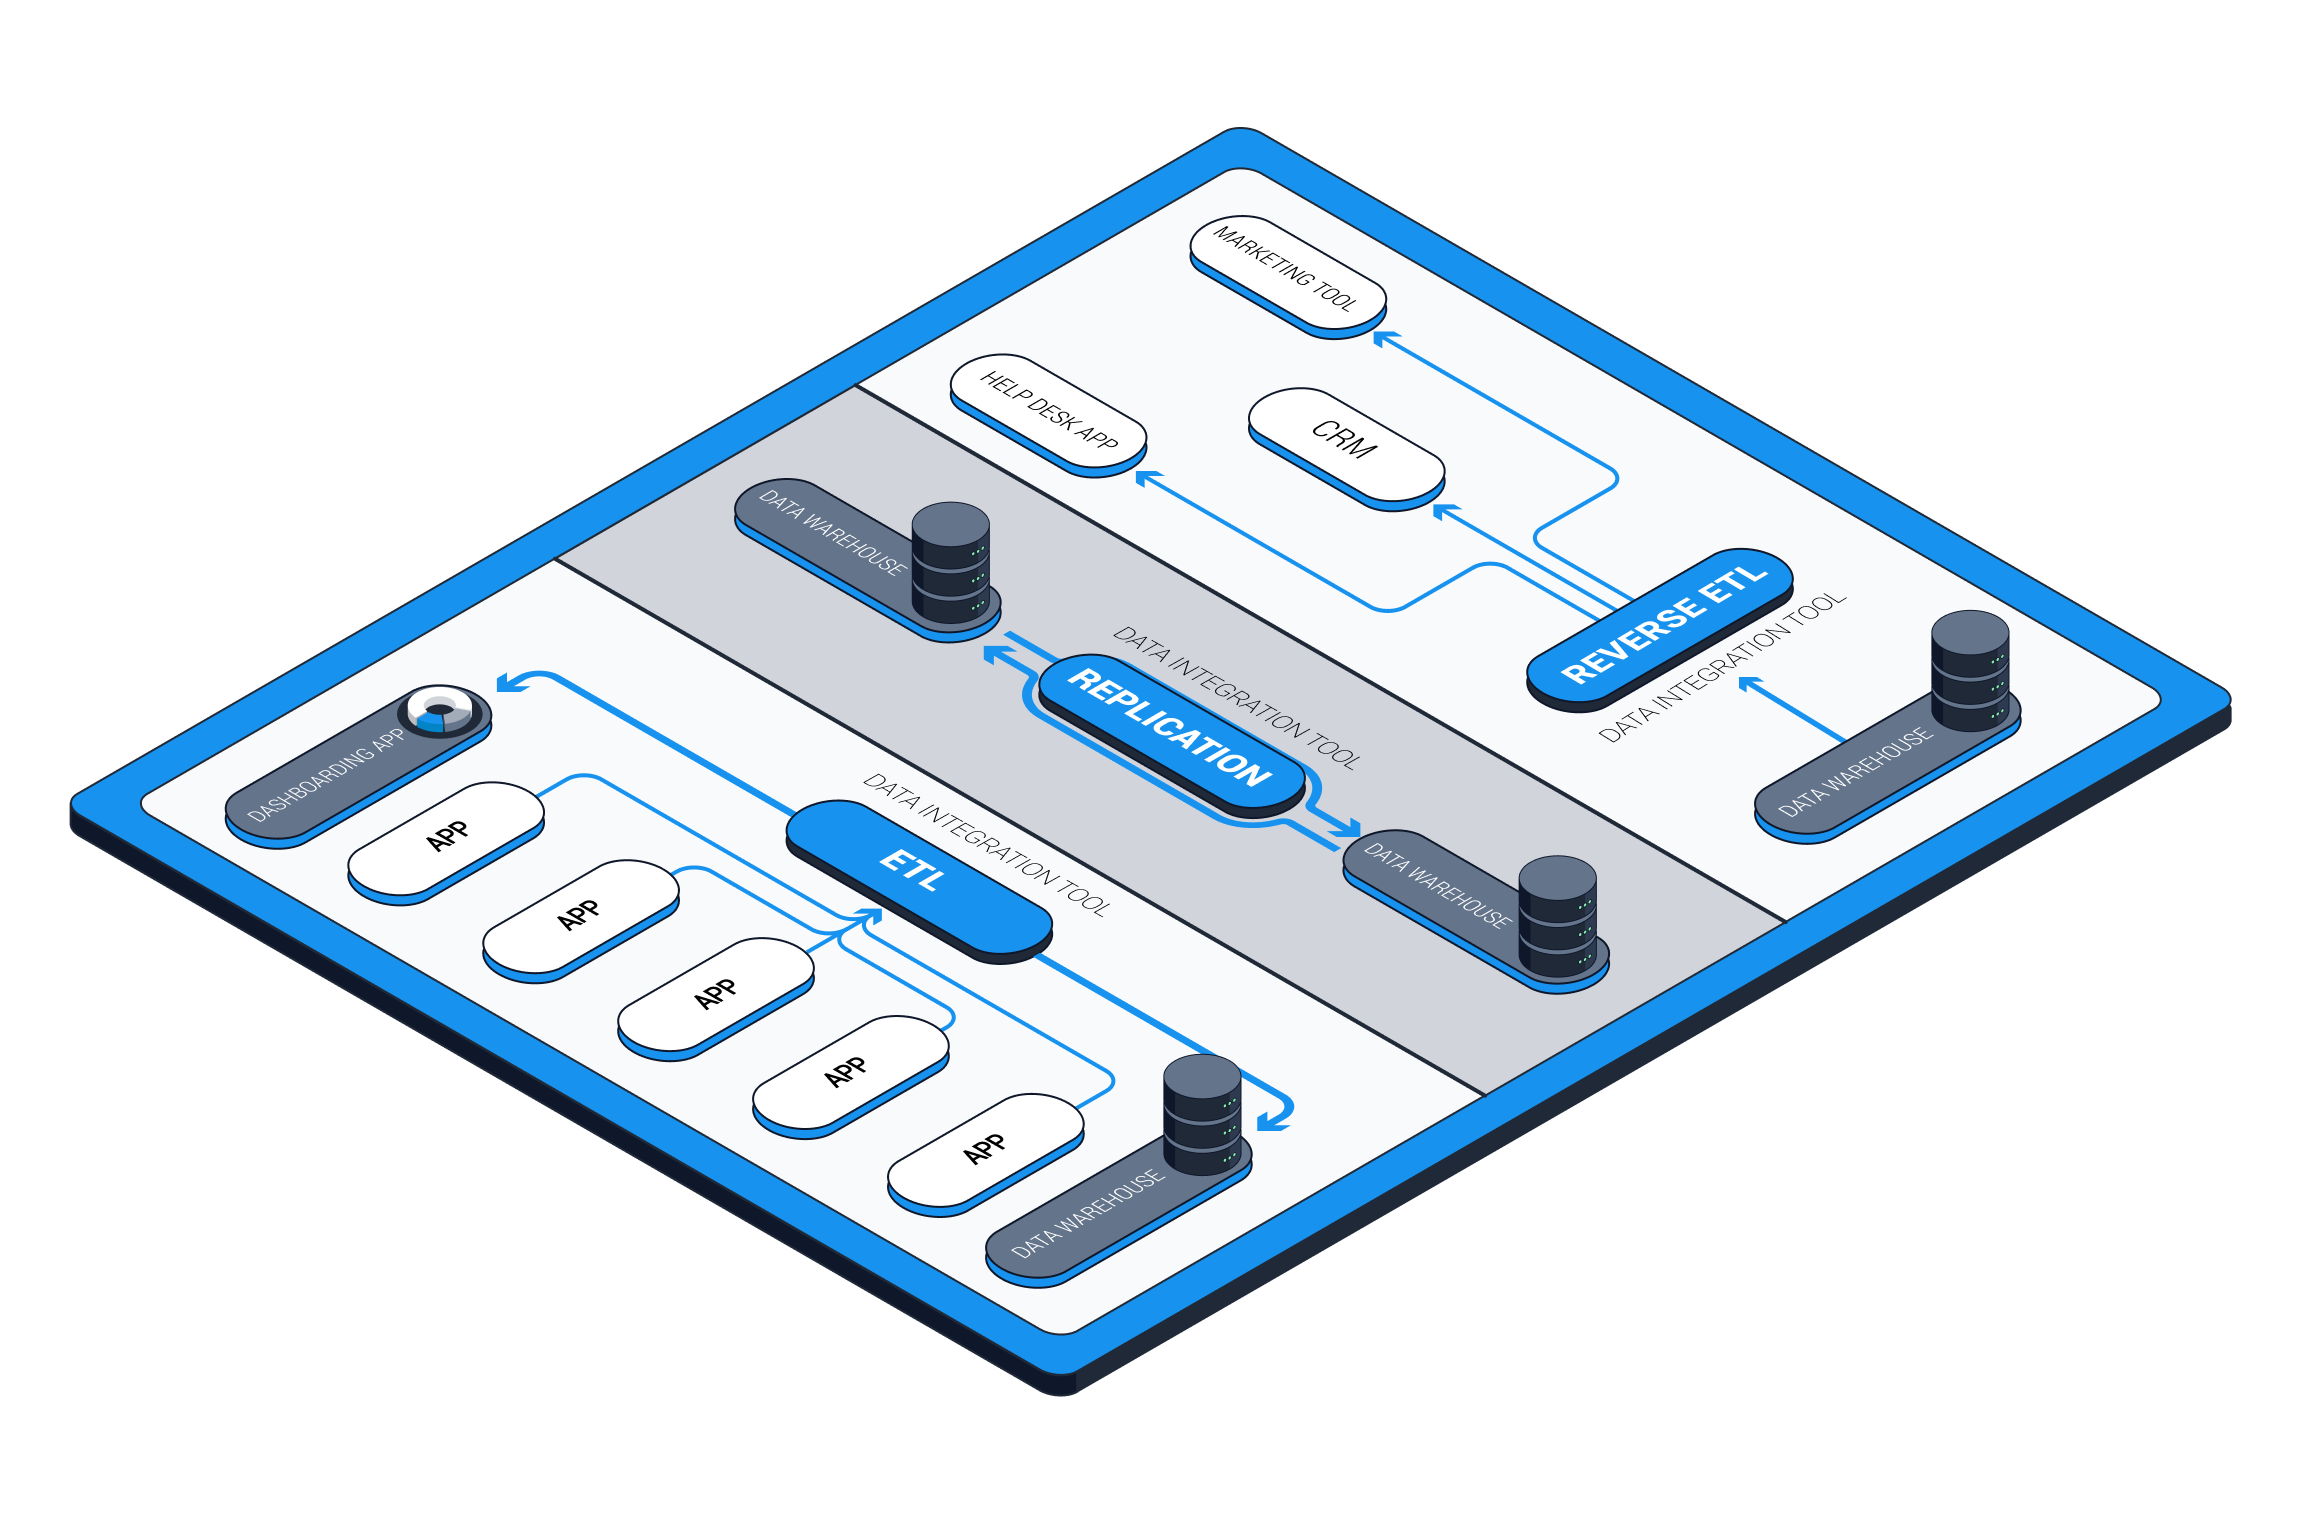
Visualization Enablement
In short: visualization enablement is the sending of data directly from business tools to visualization/dashboarding tools. This is the type of integration that’ll be the most immediately beneficial for you if you’ve made it this far in the article, and the one we’ve been talking about above. So, we’ll skip down to the second type of integration.
Data Centralization and Distribution
Visuzalization enablement is a major and necessary step towards making data profitable. But it doesn’t take long for most businesses to realize that they need to start storing their data in a database. Indeed, visualization tools don’t store data, and the computation power they offer is limited.
At the intermediate level, data integration is about centralizing your data in a storage, where it can be processed in more advanced ways before being analyzed. This type of integration is also known as ETL (extract, transform, load) or ELT (extract, load, transform).
Businesses at this stage of data maturity centralize data from all their business tools in a data warehouse or data lake, and from there send it out to visualization tools for analysis. This arrangement allows endless data manipulation for advanced insights, storage of unlimited historical data, and easy scalability.
It’s also quite common for businesses at this stage to move (or replicate) data between multiple data storages—for production, for analytics, and for backup.
Read our blog to learn how to recognize when it’s time to get a data warehouse.
Data Activation
At the advanced level, data integration is about sending processed data out from a storage into a variety of other operational tools (i.e., tools like CRMs and marketing platforms), where it can be used to power sophisticated automations.
This type of integration is also known as reverse ETL (extract, transform, load). Here are some examples of it:
- For marketing teams: You can push first-party data into a marketing platform like Google Ads to automatically hyper-personalize your campaigns.
- For sales teams: You can push customer scores into your CRM in near real time, so that your sales team can easily see it in the middle of a call?
- For product teams: You can have any kind of communication pop up in response to any customer behavior in an app.
The possibilities are endless. Read our article on data activation/reverse ETL for more info on this topic.
Now Is the Best Time to Start
Like anything worthwhile, it takes time to learn how to integrate your data and use it to make decisions that bring profits. And the need to do so will only grow as business becomes more data-driven.
Naturally, we recommend getting started with Dataddo since it’s free forever! But it’s perfectly fine if you want to start by manually exporting CSV files from the services you use and importing them into your visualization tool. In fact, why don’t you try both ways and see which one you like best?
|
Connect All Your Data with Dataddo Just a few quick steps to get your data to your dashboard for better analysis, without the hassle.
|


Comments