

Power BI and Tableau are both on top of the business intelligence and dashboarding market. But their offers, pricing, and target audience are very different. And depending on your needs, one or the other may be a much better solution for your team.
What You'll Find:
- About Power BI
- About Tableau
- The Breakdown
- The Pricing
- The Features
- More On Connectors
- The User
- The Support
- The Bottom Line
- How Can Dataddo Help?
About Power BI
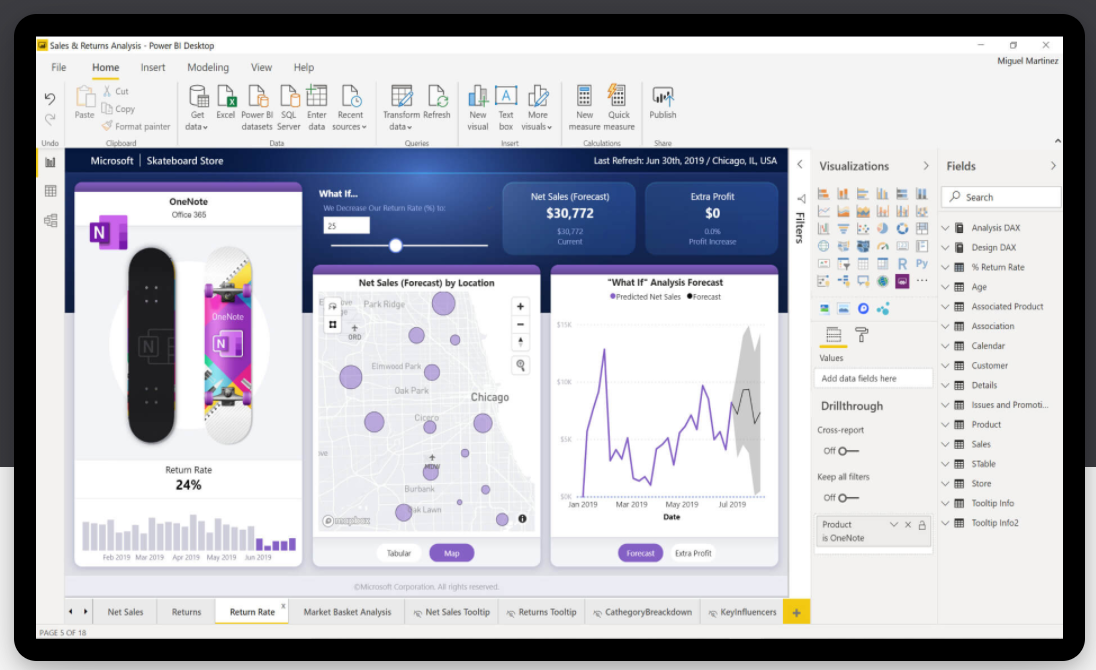
Released to the public in 2015, Microsoft’s Power BI has become a market leader in the business intelligence world. Based on the functionalities of Excel, the cloud-based analytics platform offers a wide range of visualization tools and data connections, allowing you to get a full view of your business from many data sources.
The platform is intuitive, including drag and drop capabilities, and can be easily learned, regardless of experience or expertise, allowing you to get your data into a visualization quickly. Power BI aims to provide interactive dashboards and reports that anyone can create and use.
About Tableau
Tableau, another leader in the market, is a dashboarding tool used by businesses to gain deeper insights into their data. Tableau is capable of handling a massive amount of data and transforming it into easily digestible, and attractive, visualizations.
Tableau offers collaboration tools and the ability to blend data from various sources. While coding knowledge is not required, experienced data analysts will have an easier time handling the many features and functions of the Tableau platform.
The Breakdown
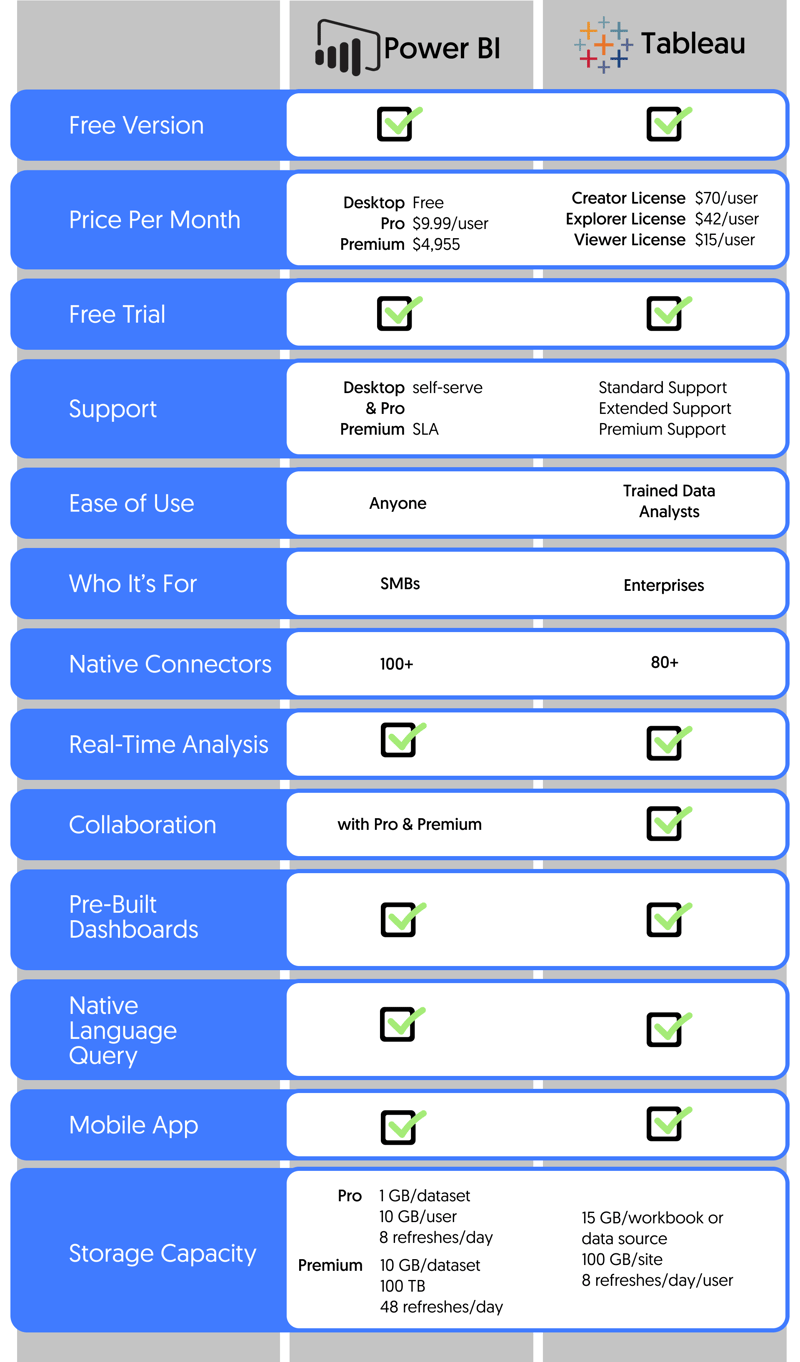
Here’s a glance at what Power BI and Tableau have to offer.
The Pricing
While both Power BI and Tableau offer free versions, the service is very limited. When we get into the different pricing of these two apps, things can get a little complicated with different features, different pricing strategies, and different licenses. Power BI offers a free version, a monthly subscription, and a scalable premium version while Tableau takes a different route with its pricing options, offering licenses with different capabilities within the Tableau platform.
Power BI
Power BI’s free version, Power BI Desktop, offers the core functionalities of the paid plans - cleaning and preparing data; connecting to data sources; and custom reports and dashboards. However, Power BI Desktop does not allow sharing of dashboards and provides limited storage capacity.
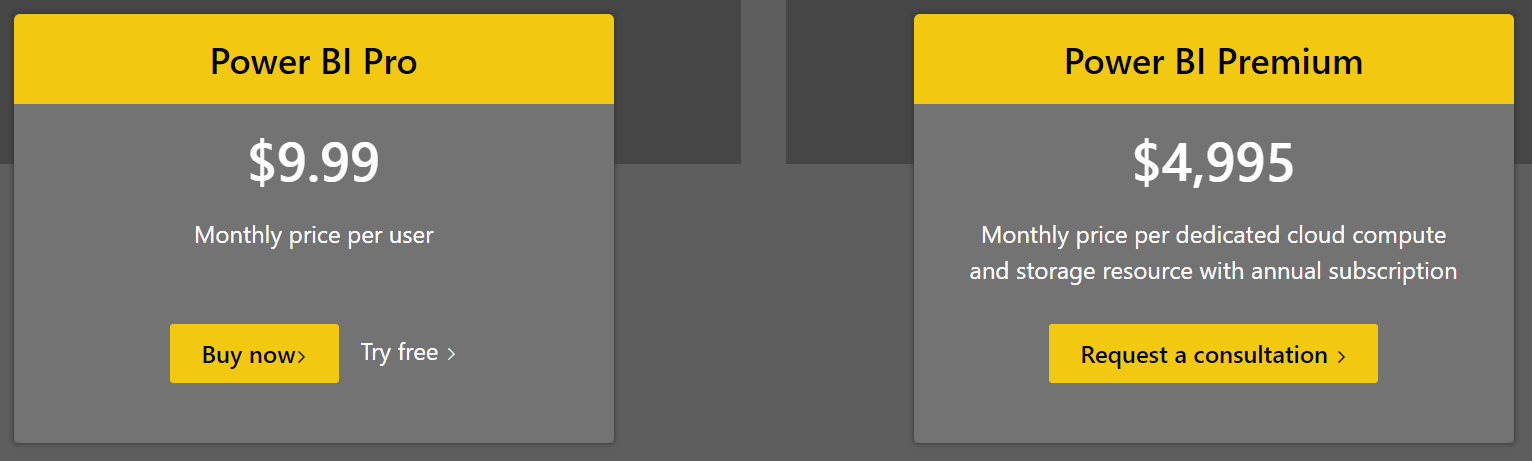
The lower-priced subscription offering is Power BI Pro at $9.99 per month, per user, billed annually. With the Pro level, users have 1 GB of storage available per data set and 10 GB per user. The big difference between Desktop and Pro is the ability to collaborate with other Pro users.
Then there’s a big jump in price to $4,955 per month for the Premium plan. This plan is geared more towards enterprise businesses and offers wildly more storage capacity, an easier time sharing content created on Power BI, and a dedicated compute processing environment.
Tableau
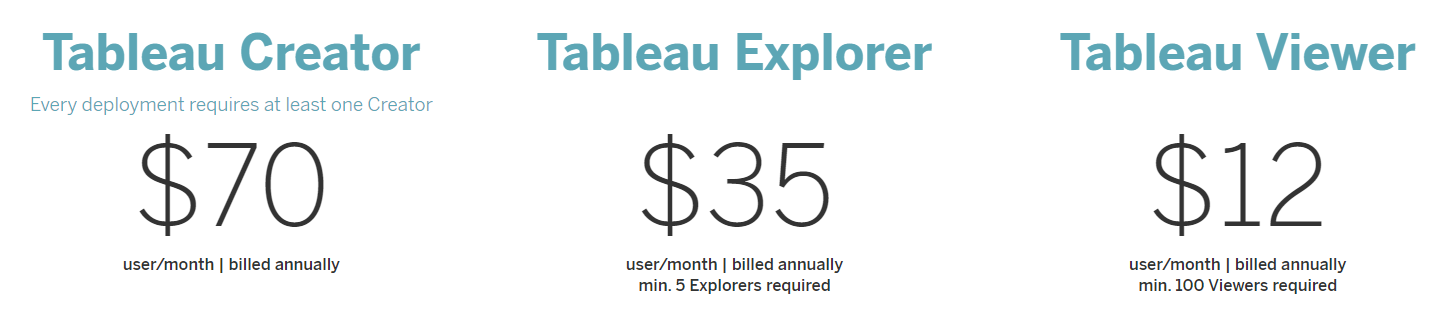
Tableau takes an entirely different approach with a tiered system based on access. Every Tableau deployment is required to have a Creator License. At $70 per user, per month, the Creator does just that - creates. With access to collaboration tools, and the ability to prepare data and create visualizations, the Creator License should go to your dedicated data analyst.
For those who will just be working off existing dashboards, there’s the Explorer License at $42 per user, per month, and a 5 user minimum. Another aptly named license, the Explorer is able to view and interact with dashboards as well as edit existing dashboards and create visualizations from existing data sources. This license enables users to create while avoiding the tedious prepping and cleaning of the data beforehand.
And finally, Tableau offers the Viewer License. (They really get to the point with their license naming.) You guessed it - Viewers have limited functions and capabilities but have access to view all published dashboards and content and can still interact with visualizations. But there is a minimum of 100 users before you gain access to this license.
While Power BI wins out as the cheaper of the two, it can still prove to be costly with adding more users and if in need of more space. So is Tableau really worth all the extra money? Let’s take a look at some of the features for both platforms and you can be the judge.
⇑ Back to TopThe Features
Now that we’ve covered the pricing, let’s get to the good stuff - the features. We know that both Power BI and Tableau are incredibly powerful tools and while there is some overlap in the features they provide, both tools have some extras that may make or break your decision.
- Natural Language Processing Tool. This means you can ask a question in normal, plain language and it will give you a result based on the data. Both Power BI and Tableau offer this service with Q&A and Ask Data, respectively.
- Native Connections. Both tools provide native connections to various data sources so you can bring all of your data together in one dashboarding tool. Tableau currently has more than 80 connections while Power BI has more than 100, including the whole Microsoft suite of services. Connecting Power BI to your data sources really takes just a few clicks while Tableau is a bit more involved with more extensive authorization processes.
- Real-time Data. The ability to have real-time updates to your dashboard can be crucial to your work flows and business operations. Both Power BI and Tableau allow for interactive real-time dashboards for the best and most up-to-date analytics. However, Tableau has been reported to be a bit speedier with those updates.
- Collaboration. Yes, they both offer collaboration tools but they do differ in that Power BI does not offer the ability to share with it’s free version, whereas any version of Tableau has collaboration opportunities.
- Pre-built Dashboards. One of the many great things about both of these tools are the pre-built dashboards, cutting down the time it takes you and your team to get your data visualized. You can find some beautiful Tableau starters here.

- Mobile App. So you can analyze on the go. With both apps, users are able to look at and manipulate existing dashboards, giving you access to your data at any time.
- Embedding Visualizations. This is a feature that Power BI offers easily while Tableau has a few more hoops to jump through. Because Power BI is a Microsoft creation, it’s easy to embed your dashboards or graphs into SharePoint or import to Excel. Power BI also makes it easy to add visualizations directly to your website, or really anywhere, including in emails. However, this is only available with the paid versions.
- Data Blending. Blending and mixing data from different sources can be a vital action in seeing the whole picture of your business. Tableau offers this function quite easily whereas the process gets a bit more time intensive with Power BI.
- Data Points & Row Limits. Another important point that Power BI falls short on. Tableau is able to create visualizations with an unlimited amount of data points whereas Power BI only allows up to 3,500. Both Power BI and Tableau do not have row limitations for imported data, however, Power BI does have capacity limitations of 1 GB for the free version and 10 GB for the Pro tier.
More On Connectors
If you’re trying to connect all of your data sources to your Power BI or Tableau dashboards, there is the native connector option. However, the native connector options may not be as extensive as some third-party data integration platforms. You may also run into limitations with native connectors that won’t be a problem with third-party connectors.
Third-party data integration platforms, such as Dataddo, offer another option with fewer limitations and endless connector possibilities with the availability of custom connectors. Once you decide on using a third-party connector, it’s a matter of researching which platform will work best for your needs and your budget.
The User
By now, you may have a pretty good idea of which tool would work best for you and your company. But let’s add another factor to the mix - ease of use. While both Tableau and Power BI do not require any coding knowledge, they do have varying degrees of complexity.
Power BI
Power BI is known to be the easiest of the two and was created with the average user in mind, providing pre-built dashboards that don’t require any previous training or experience. No fancy data science degrees are needed here, so anyone in your organization can quickly create dashboards from their preferred data sets. Power BI is especially easy to use if you have any experience with Excel, as the core concepts of the dashboarding platform are based on the spreadsheet application.
With its lower cost, intuitive interface, and pre-built dashboards, Power BI is geared more towards small and medium-sized businesses that may not have the financial capital and/or the human expertise of a more in-depth BI tool. However, it is still a very powerful tool and can deliver real solutions to any business intelligence or dashboarding need for an organization of any size.
Tableau
Tableau, on the other hand, was built pretty specifically for data analysts. While it is possible to learn, it has a much steeper learning curve. Users of Tableau need to have a deeper understanding of their data sets in order to take advantage of the full functionality of the platform. And with it’s somewhat cluttered interface featuring many menus, the platform isn’t entirely as intuitive as Power BI may be for most users.
With the price point and required previous experience, Tableau is more suited for enterprise businesses that have money to spend on a BI tool such as Tableau and also have trained employees to work with the tool.
⇑ Back to TopThe Support
Working with such powerful tools as Power BI and Tableau can be a bit intimidating, especially for users without experience. So having support available can be an important factor in the decision-making process.
Power BI
Power BI offers little support other than their community pages and available resources on their website such as guided learnings, webinars, and documentation. While the resources are extensive, finding solutions to problems quickly may be a difficult task with waiting times at one business day minimum for Pro users.
There are higher support level options available with a Premium account such as the ability to call the support center and gain access to the Microsoft 365 admin center. And administrators of each Power BI deployment also have access to the Microsoft 365 admin center as well as the ability to get in touch with the support center via phone.
The highest level of support is offered at the enterprise level and includes a dedicated account manager and offers proactive training and support.
Tableau
Tableau automatically offers standard support for all paid subscriptions, with options to renew the service yearly after the first year. Standard support offers access to the communities and knowledge base, and response times during business hours of 8-24 hours, depending on severity.
The highest level of support, Premium Support, gives you everything from an account manager to access to special forums and programs. Premium Support offers more proactive care than the other two levels of support and, like Power BI, is geared towards enterprise clients.
⇑ Back to TopThe Bottom Line
Both Power BI and Tableau are powerful and useful business intelligence solutions that provide the ability to create beautiful visualizations from a large amount of data. But the two tools are made for very different audiences.
It really comes down to the experience of the users and the amount of capital your organization is willing to put into your BI tool. If you’re a small company that doesn’t employ any data analysts, it might be easier for your employees to go after Power BI as your dashboarding and BI tool. Whereas, if you’re a large company with both monetary and human capital to invest in, Tableau would be a viable option.
|
Power BI or Tableau? Either way, we got you covered! Connect any and all of your data sources to the BI tool of your choice so you can get to visualizing.
|


Comments