
I don’t have to tell you that Looker Studio is a very powerful tool. But you've probably found that there are some things you just can't do well, or easily, in Looker Studio.
Example: Having multiple date ranges in the columns of a single table.
The easy way out is to create a table for each date range. But then you end up having a mess of tables in your dashboard that is in no way as pretty and easy to read as it should be.
So, what’s a solution that’s easy to implement and will also maintain the integrity (and aesthetics) of your dashboard?
The answer is data blending.
Want more Looker Studio tips & tricks?
Find out how to track your Instagram follower count in Looker Studio.
How to Blend Data in Looker Studio
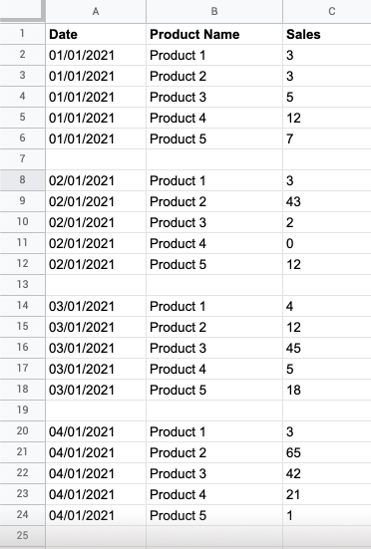
For this example, let’s say I want to view my sales numbers per week. So, I want to create a table with:
- the names of my products,
- a dynamic date range,
- and the number of sales.
With this simple data set, your table will probably look something like this:
But, I want to see something like this:

Get your data to Looker Studio, ABSOLUTELY FREE, with Dataddo's Free forever plan.
Here’s where the blending comes in.
- With your table selected, click on ‘Blend Data’ under the Data tab.
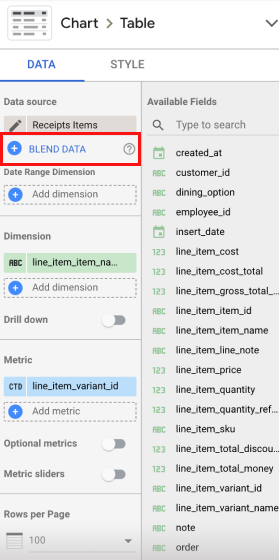
- Now, you’ll select your dimensions, metrics, and date range. In this example, I want my dimensions to be “line_item_item_name”, the metrics to be “line_item_quantity”, and my date range to be “receipt_date”.
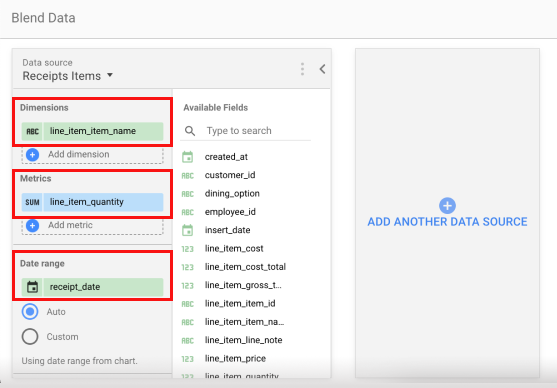
- The date range will be set to ‘Auto’ by default (as seen in the above image). But we’re going to select ‘Custom’ and then select ‘Last 7 Days’. Doing this will make the date range dynamic, meaning the data will update to show data from the last seven days, not a specific date.
 Note: If you don’t need a dynamic date range, you can select the specific dates you would like to look at in this step.
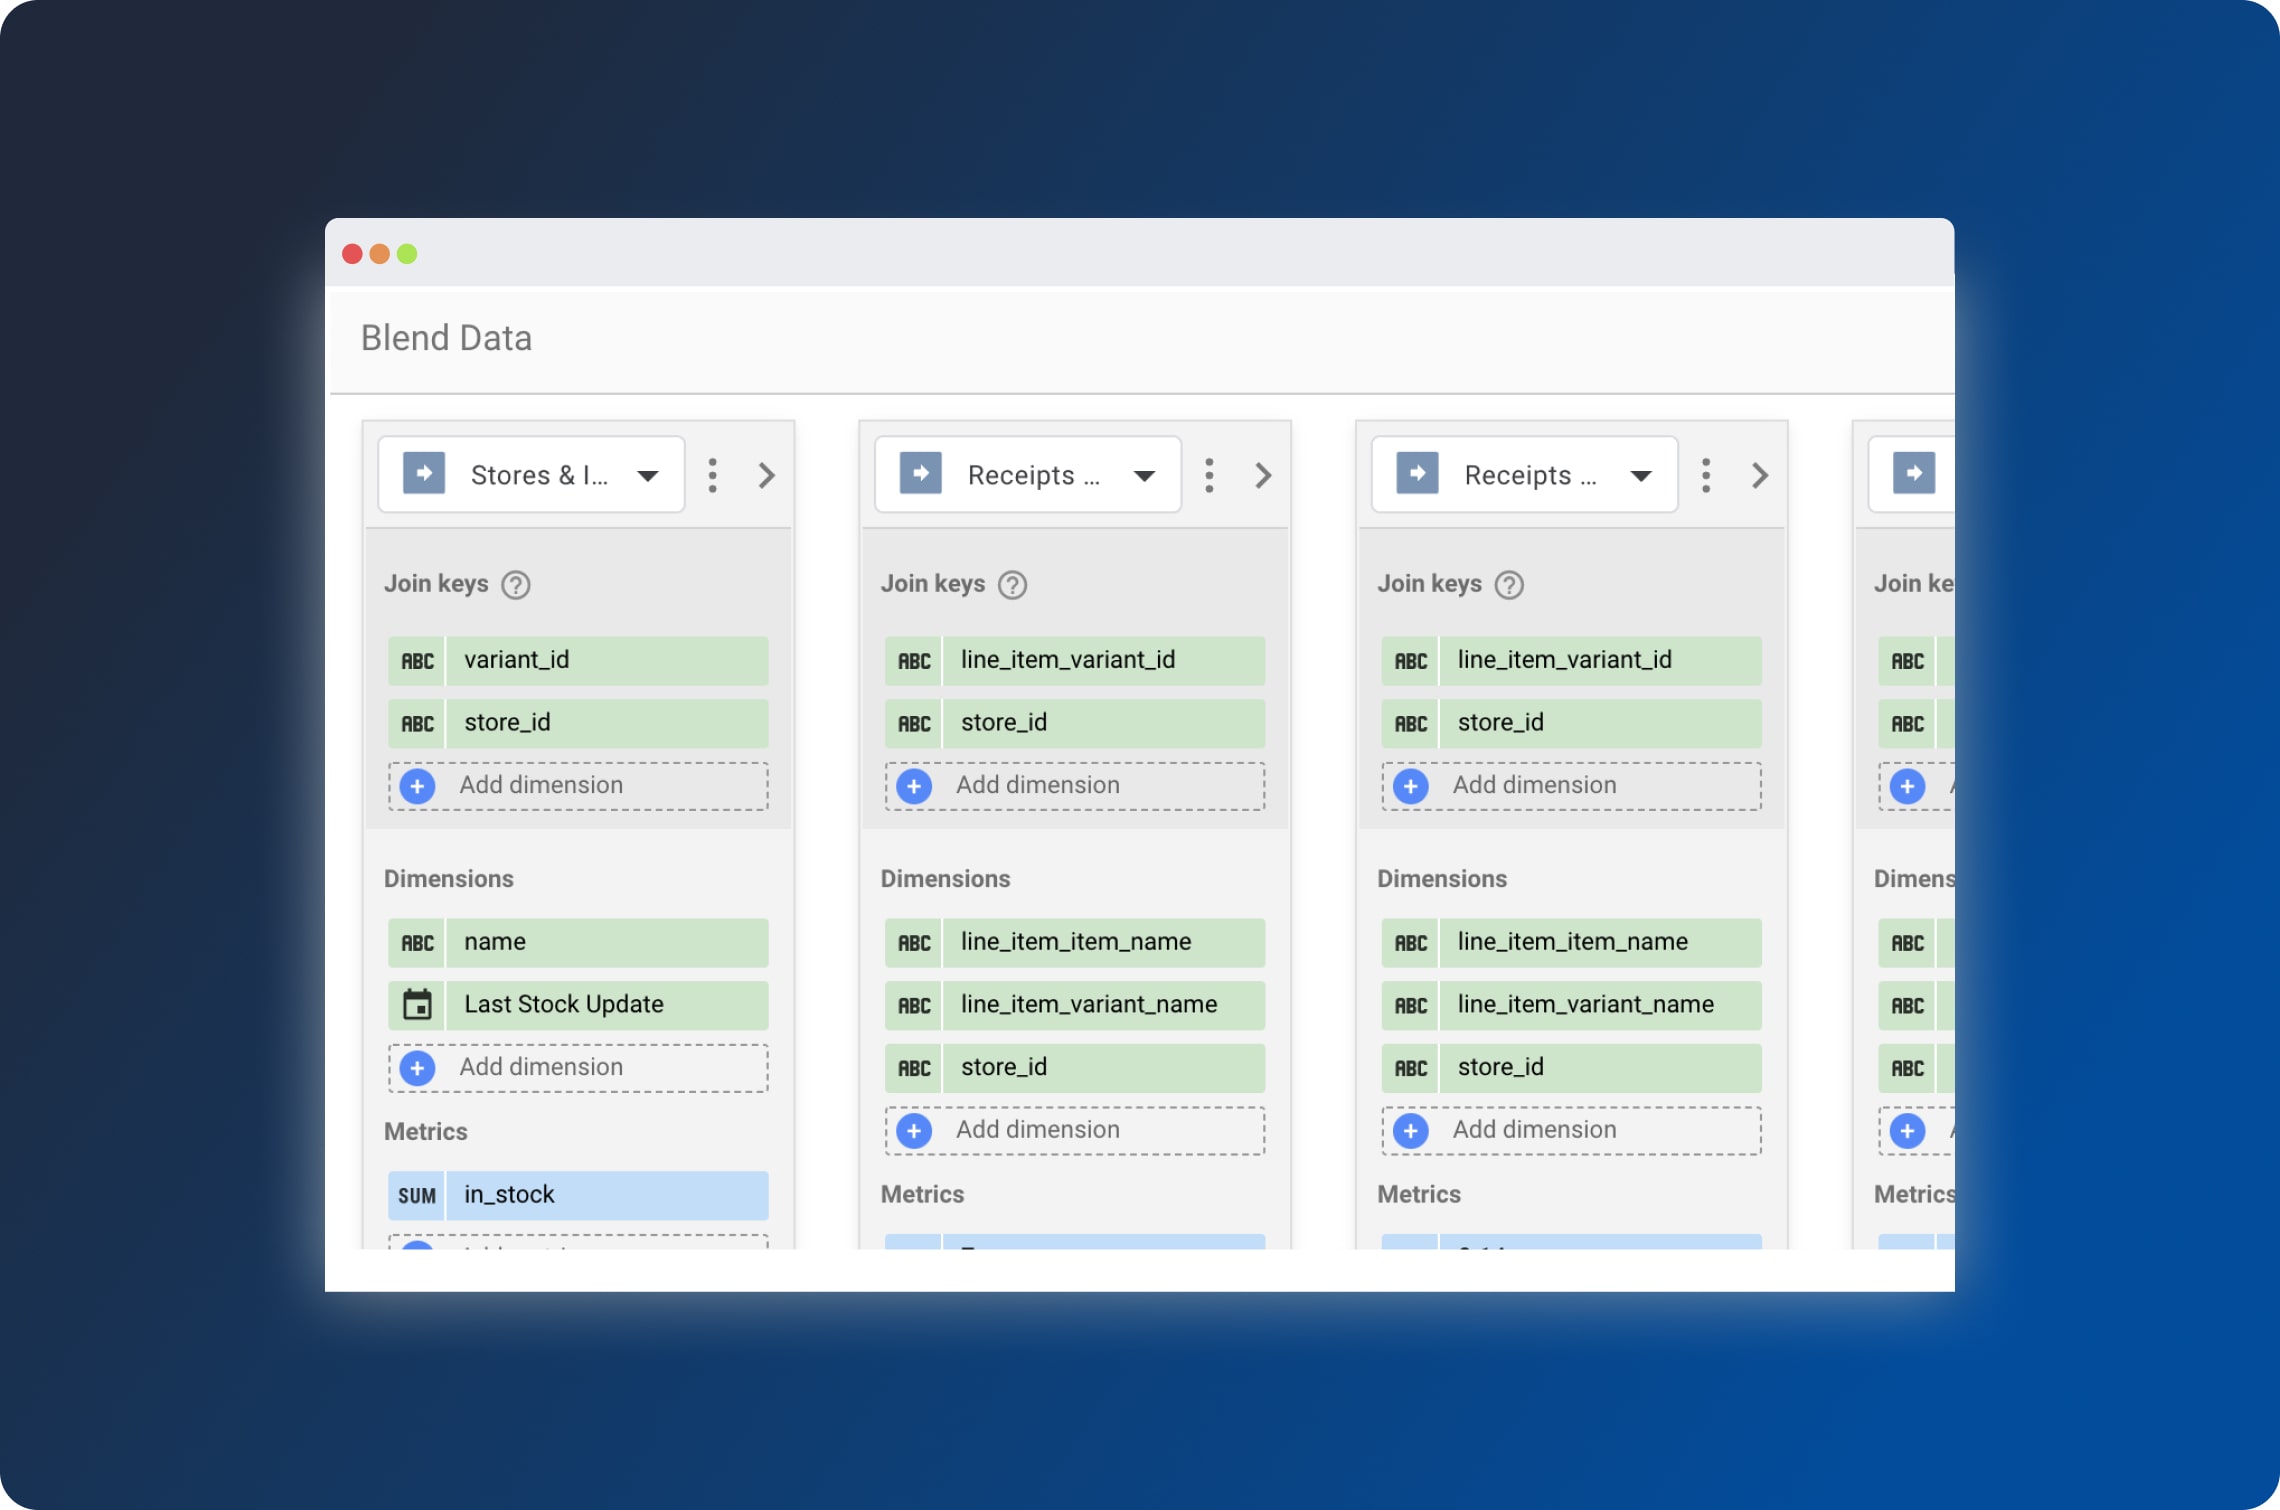
 - Now, click ‘Add Another Source’ and select the same data set as previously.
- Under ‘Join Keys’, we will select “line_item_variant_id”. These are unique numbers associated with each product in my store, such as a SKU. The join key will match data from both sets based on our selected key - the product ID.
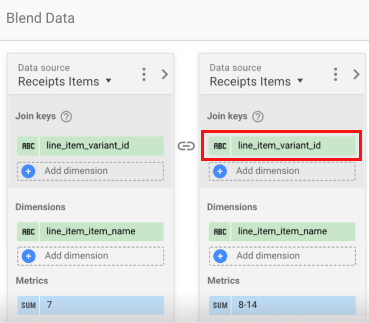
Note: A join key must be a unique identifier that is present in every data set you are blending (in this case, we’re using the same data set). Other common join keys might be customer ID, email address, or receipt number. - Next, you’ll input the same dimensions and metrics as in step 2. Dimensions will be “line_item_item_name”, metrics set to “line_item_quantity”, and date range will be “receipt_date”.
- The date range will be set to ‘Auto’ again and we will go through the same process of selecting ‘Custom’. But this time, we will set the calendar pop-up to ‘Advanced’ in the top right corner (the very last option). This will allow us to create a new dynamic date range.
Set the start date to today’s date and the end date to one week from now. Set to ‘minus’ for both dates and then input ‘14’ under today’s date and ‘8’ under the other date. This will create a date range of 8-14 days ago. Then click ‘Apply’. Pro Tip: Use custom names for your metric fields to describe which date range the metric is coming from to make your newly blended data sets easier to understand. I’ve named my new field ‘8-14’ to signify the data is based on sales numbers from 8-14 days ago.
- Repeat steps 4-7 to add more date range columns to your table.
Note: Looker Studio only allows up to five data sources to be blended in one table. - Once you have all of our sources connected, name your new source, save it, and you can create your table!
Your table will now pull data from the different date ranges of the data set you have blended so you can view your metrics from multiple date ranges all in one place.
Having Trouble Getting Data into Looker Studio?
If you’re spending hours on manually extracting data from your data sources to be imported into Looker Studio, you’re wasting your time! With a no-code data integration platform like Dataddo, you can get your data automatically updated in Looker Studio (or any destination) so you’re always looking at the most up-to-date info.
With more than 150 out-of-the-box data sources available, you’re sure to find all the connections you need. Still can’t find the source you’re looking for? Contact the tech team about setting up a customized connector in less than a week.
But you don’t have to take our word for it. Try out the platform with a 14-day free trial, including free onboarding assistance and full platform functionality.
Get the most out of your data with the help of Dataddo.
|
See how Dataddo can help your business, FOR FREE Just a few quick steps to get your data to your dashboard for better analysis, without the hassle, and without the cost.
|


Comments