
Fortunately, tracking analytics and KPIs across multiple Shopify stores and third-party services is easier than it’s ever been. But how exactly to do it may not be obvious or straightforward.
By the time you finish reading this article, you'll know how to export Shopify data from multiple stores—as well as any other third-party services—and then import it into any dashboarding tool (for analysis) or data warehouse (for storage and processing).
Shortcuts:
- How to export Shopify data manually
- How to export Shopify data automatically
- Why use Dataddo to export Shopify data?
- Dataddo case study: How Lounge Underwear combined data from 9 Shopify stores
How to Export Shopify Data Manually
For ad hoc or one-off situations, manual data export is a simple and reasonable solution, which involves downloading CSV files from various Shopify pages.
In this example, we'll export order data.
- Navigate to the Orders tab in the admin section of Shopify.
- Select a time period (30 days in this example), then click the order data you would like to export ("Total orders" in this example).

- Once your report loads, you'll see an Export button in the top right corner. Click it to download a CSV file.

- In your CSV file, you'll need to clean and organize the raw data before importing it into a dashboarding or BI tool. This may include:
- Removing unnecessary columns
- Checking for and fixing errors (e.g., incorrect date or currency formats)
- Deciding how to deal with missing data (e.g. by removing their rows, or replacing the values with average values from similar data points)
- Upload the file to Power BI, Tableau, Looker Studio, or any other visualization tool or database. In Power BI, for example, click Get data from another source or Get data from the header menu; then click Text/CSV and Connect to import your CSV data.

- Repeat this process with data from your other Shopify stores until you have all the data in your destination, ready to analyze for insights.
As you can see, the process of exporting a single dataset from a single Shopify store is quite simple; manually exporting reports, products, and other Shopify data works similarly.
But, what if you have 5 different datasets you want to compare across 10 Shopify stores, and you want to refresh the data 5 times per week? Even worse—what if you want to combine all this data with data from other social and marketing platforms? You can imagine how quickly the situation would become a Sisyphean nightmare.
This leads us to the next approach: How to automate export of Shopify data.
How to Export Shopify Data Automatically
The best way to automatically export data from multiple Shopify stores and have it continually refresh in your data destination is by using a tool like Dataddo.
When automatically exporting data from Shopify with Dataddo, you can:
- Send it to a visualization tool like Looker Studio or Google Sheets.
- Send it to a data warehouse, where you can store and combine it with other company data.
We'll discuss both options below.
Extract Shopify Data Directly to a BI Tool or Dashboarding App
If you don't have a data warehouse, this is the approach you'll want to take.
- Log into your Dataddo account. If you don't have one, sign up for free. The interface is user-friendly and you'll be able to operate it no matter your level of technical expertise.
- Click Create Source from the home screen.

- Then select Shopify from Dataddo's list of connectors.

- Select your dataset and click Next.

- On the page that follows, you'll be prompted to authorize your Shopify account. Provide your credentials and click Save.
- Next, select your metrics and attributes. The metrics and attributes available depend on the dataset you've selected.

- Configure your sync preferences by choosing your date range, sync type, frequency, time, and timezone. You can also load historical data, as well as preview your data, in this step.

- Click Save and your data source will be ready!
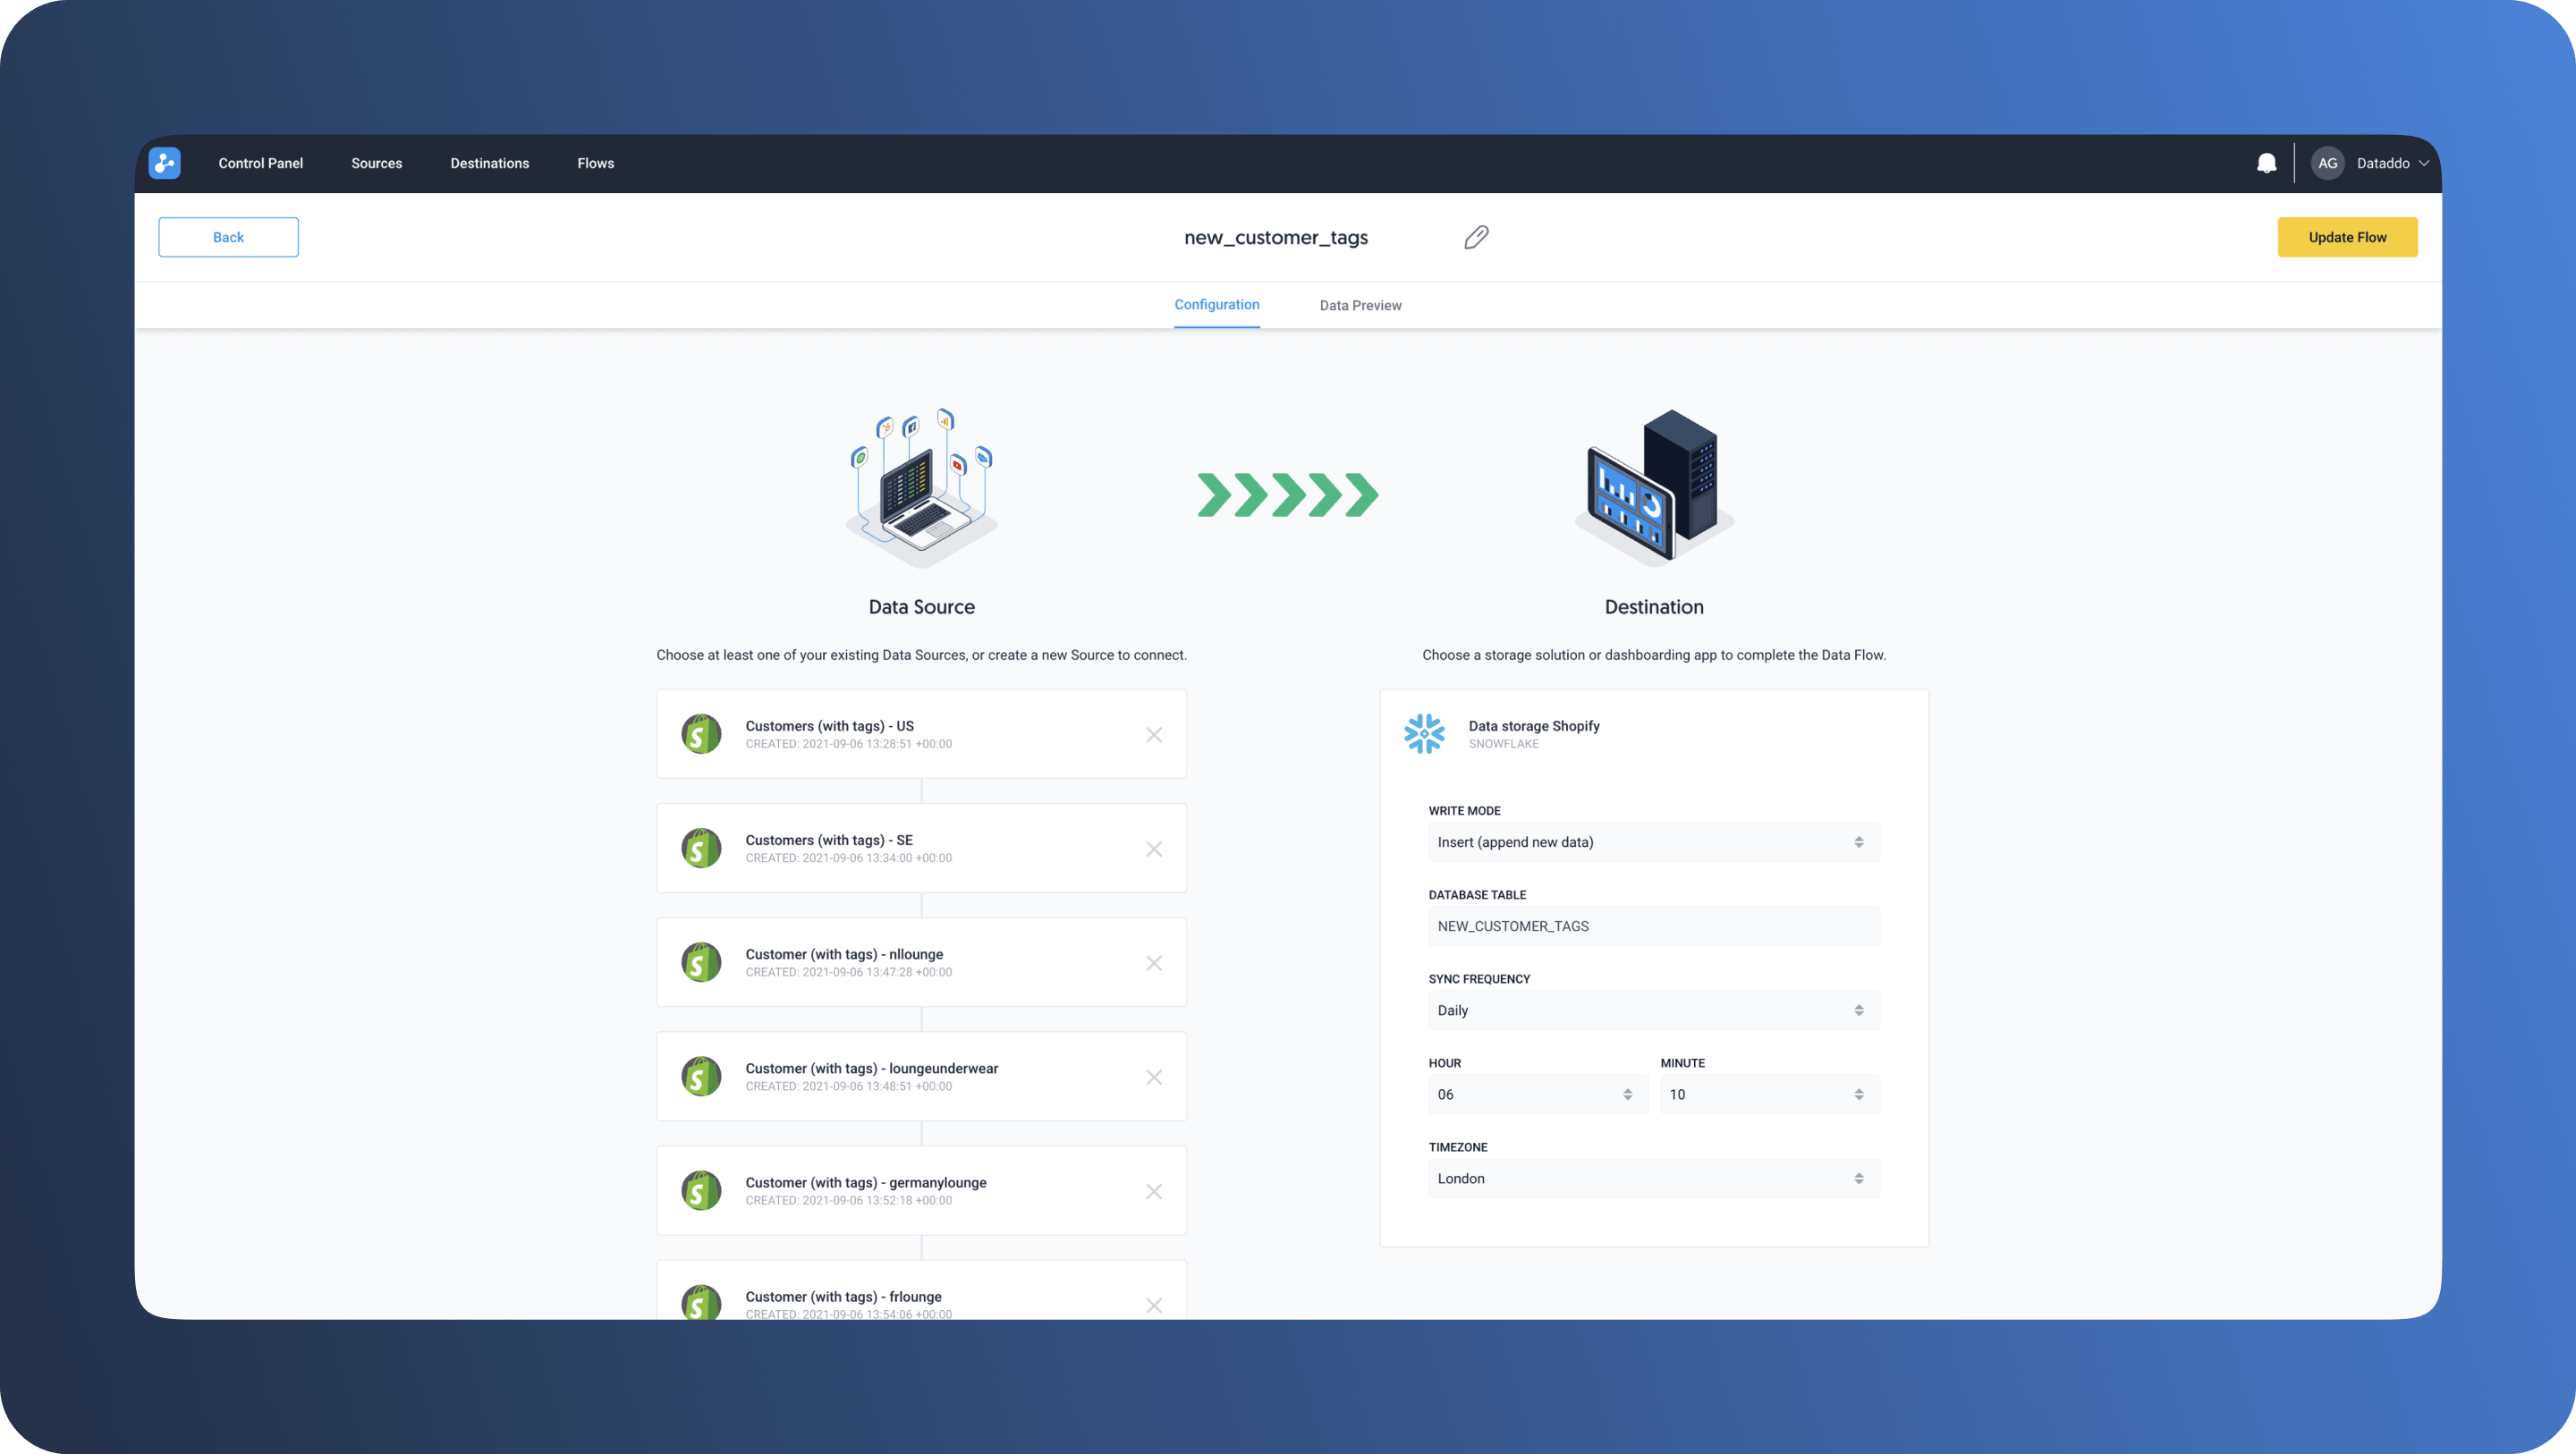
- Now, go back to the home screen of the Dataddo app and click Create Flow.

- Click Connect Your Data and add the Shopify source you just created.
- Then click Connect Your Data Destination and choose where you want to send your data. In this example, we will choose Power BI.

- Then click Create Flow and a popup will appear, showing you how to configure Power BI to receive your data.
Once you've configured your destination, your Shopify data should automatically refresh there at the intervals you've chosen.

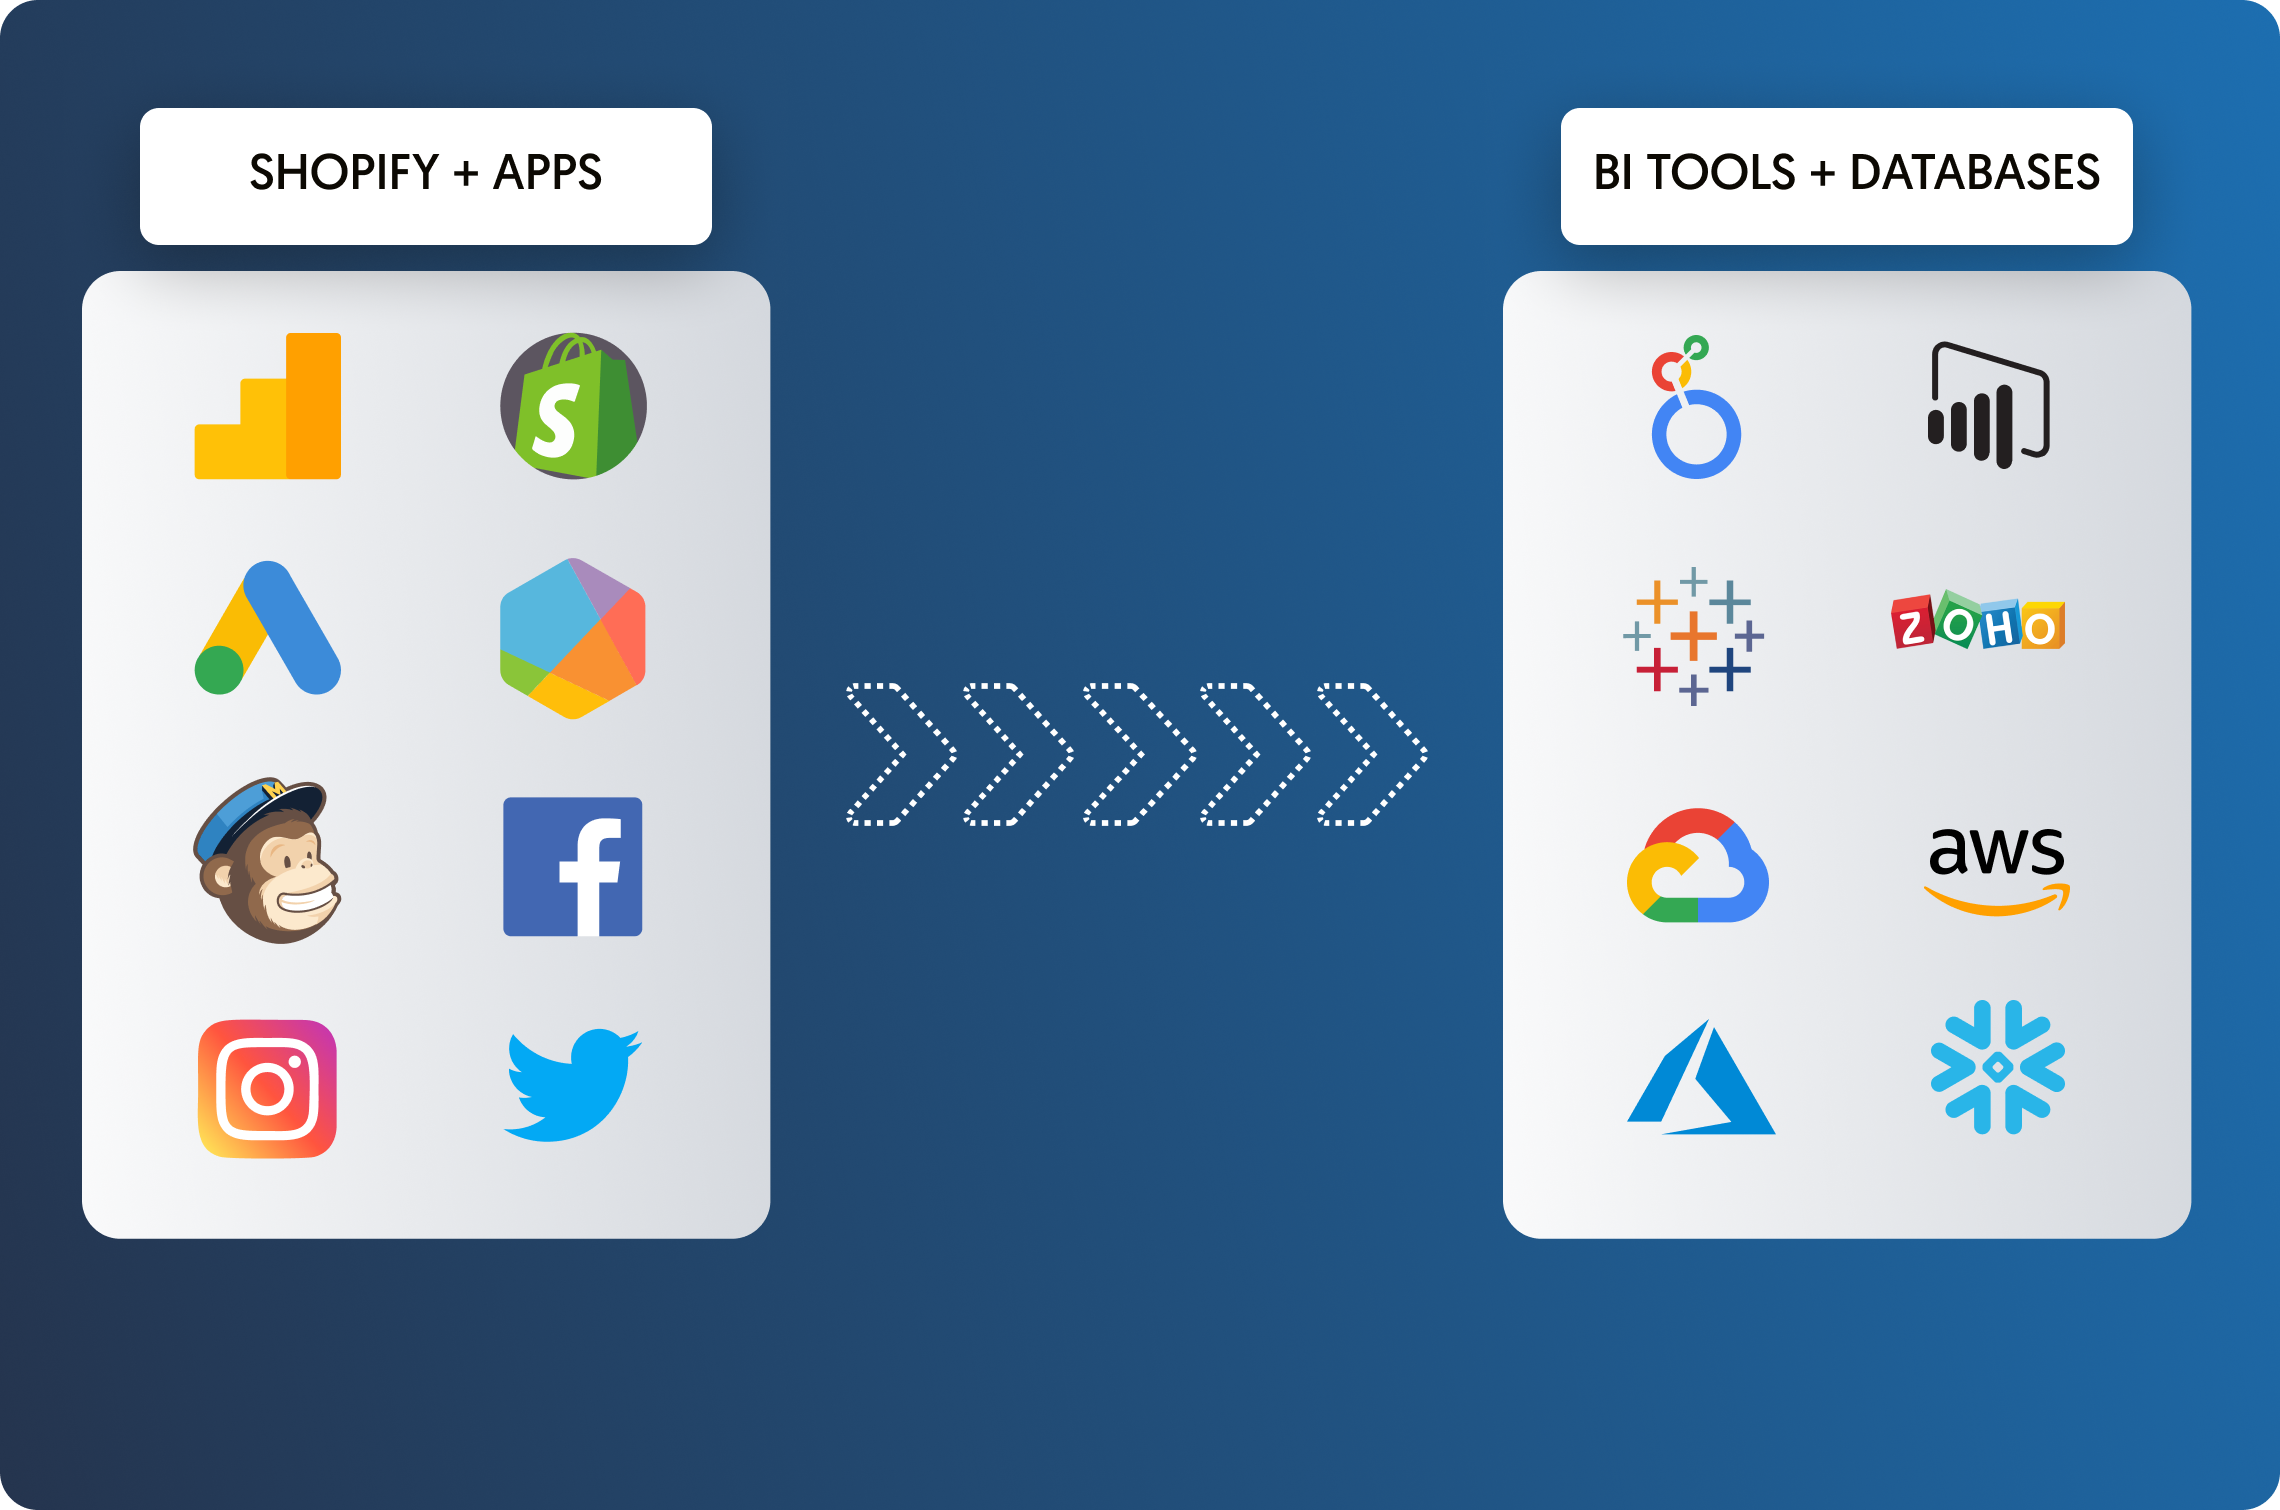
To build comprehensive dashboards, repeat this process with datasets from your other Shopify stores, as well as datasets from other third-party services, like:
- Advertising data (e.g. from Google Ads, Facebook Ads)
- Customer service data (Zendesk, Freshdesk)
- Financial data (Stripe, Rebound Returns)
- Other customer data (Salesforce, Mailchimp, etc.)
Dataddo will automatically pre-clean and standardize data from all your sources, so that once it hits your dashboard, it's ready to analyze.
And you'll never have to worry about your dashboards breaking, because our team of engineers proactively monitors and maintains all connections.
Extract Shopify Data to a Data Warehouse
In the Dataddo app, the process of sending your data from Shopify to a data warehouse is almost the same as sending it from Shopify to a BI tool, so in this section we'll talk about why and when you should consider sending your Shopify data to a warehouse.
Let's start with why. Two reasons.
Number one. Sending large amounts of data directly to a dashboarding application like Looker Studio might cause the app to crash. Also, since most third-party services only allow storage of data for a limited period of time, the only way to maintain a complete historical picture of your business is by sending it to a data warehouse.
Number two. You can’t flexibly combine data from third-party services by plugging them directly into a dashboarding app. Computation of more advanced metrics is best done in a warehouse.
So, without a cloud-based data warehouse like Google BigQuery or Amazon Redshift, which can store essentially limitless amounts of data that can be queried on demand, you can only reap limited benefits from using a dashboarding app.
For more information on how to choose a data warehouse that suits the needs of your organization, see our blog on the best cloud data warehouse solutions and how to choose the right one.
If you're not sure whether it's time for you get a warehouse, check out our article on when it's the right time to invest in a data warehouse.
After you’ve chosen a data warehouse, you can easily redirect your Shopify data to it in Dataddo.
Dataddo supports all popular data warehouses as destinations, as well as less popular data warehouses.
Why Use Dataddo to Integrate Shopify Data?
Dataddo does more than just sync data from one tool to another. It offers a number of inbuilt features that handle common data integration problems, so that users can spend more time actually working with data in BI tools and data warehouses. Features and benefits include:
- In-app transformations. Data blending, format harmonization (ensuring data is analytics-ready), metadata inclusion, and the ability to exclude sensitive information from extractions.
- Data quality tools. Rule-based data quality monitoring and filtering, detailed monitoring and logging, easy data mapping.
- Easy troubleshooting tools. Thorough diagnostics, source and destination restart, and more.
- Certified and fully secure. SOC 2 Type II certified and compliant with all major data privacy laws around the globe, 16 data residency locations, optional SSH tunelling.
- Huge portfolio of connectors. Dataddo connects all popular apps, data storages, and BI tools, as well as less popular niche and regional services. Don't see the one you need? We'll build a new connector on request.
- Proactive monitoring and maintenance. Our engineers monitor the health of all pipelines and manage all changes to the APIs of could services, so that your pipelines don't break.
- Enables operational analytics. You can use Dataddo to send Shopify data or any other company data into CRMs (e.g., to give sales teams deeper insights), marketing automation platforms (e.g., for sophisticated targeting), and other line-of-business apps.
Huge bonus: World-class customer support. Don't take our word for it—read any reviews online to see what Dataddo users are saying!
Case Study: Lounge Underwear
To get an idea of what can be achieved by using Dataddo to integrate Shopify data, read our case study on UK brand Lounge Underwear, which has successfully used Dataddo to combine data from 9 Shopify stores.
|
Make the Most of Your Shopify Data with Dataddo Funnel all your ecommerce and marketing data to your dashboard or warehouse in just a few simple steps—for better analysis, without the hassle.
|


Comments