
This article is for marketers, product managers, and anyone else who wants to collect information about in-app or on-website user behavior, and send it to Looker Studio for analysis.
The article will focus on actually collecting the data, and then moving it into Looker via a series of essential tools (i.e., a data stack). All the tools we’ll be using are free.
Setting Up Your (Free) Data Stack
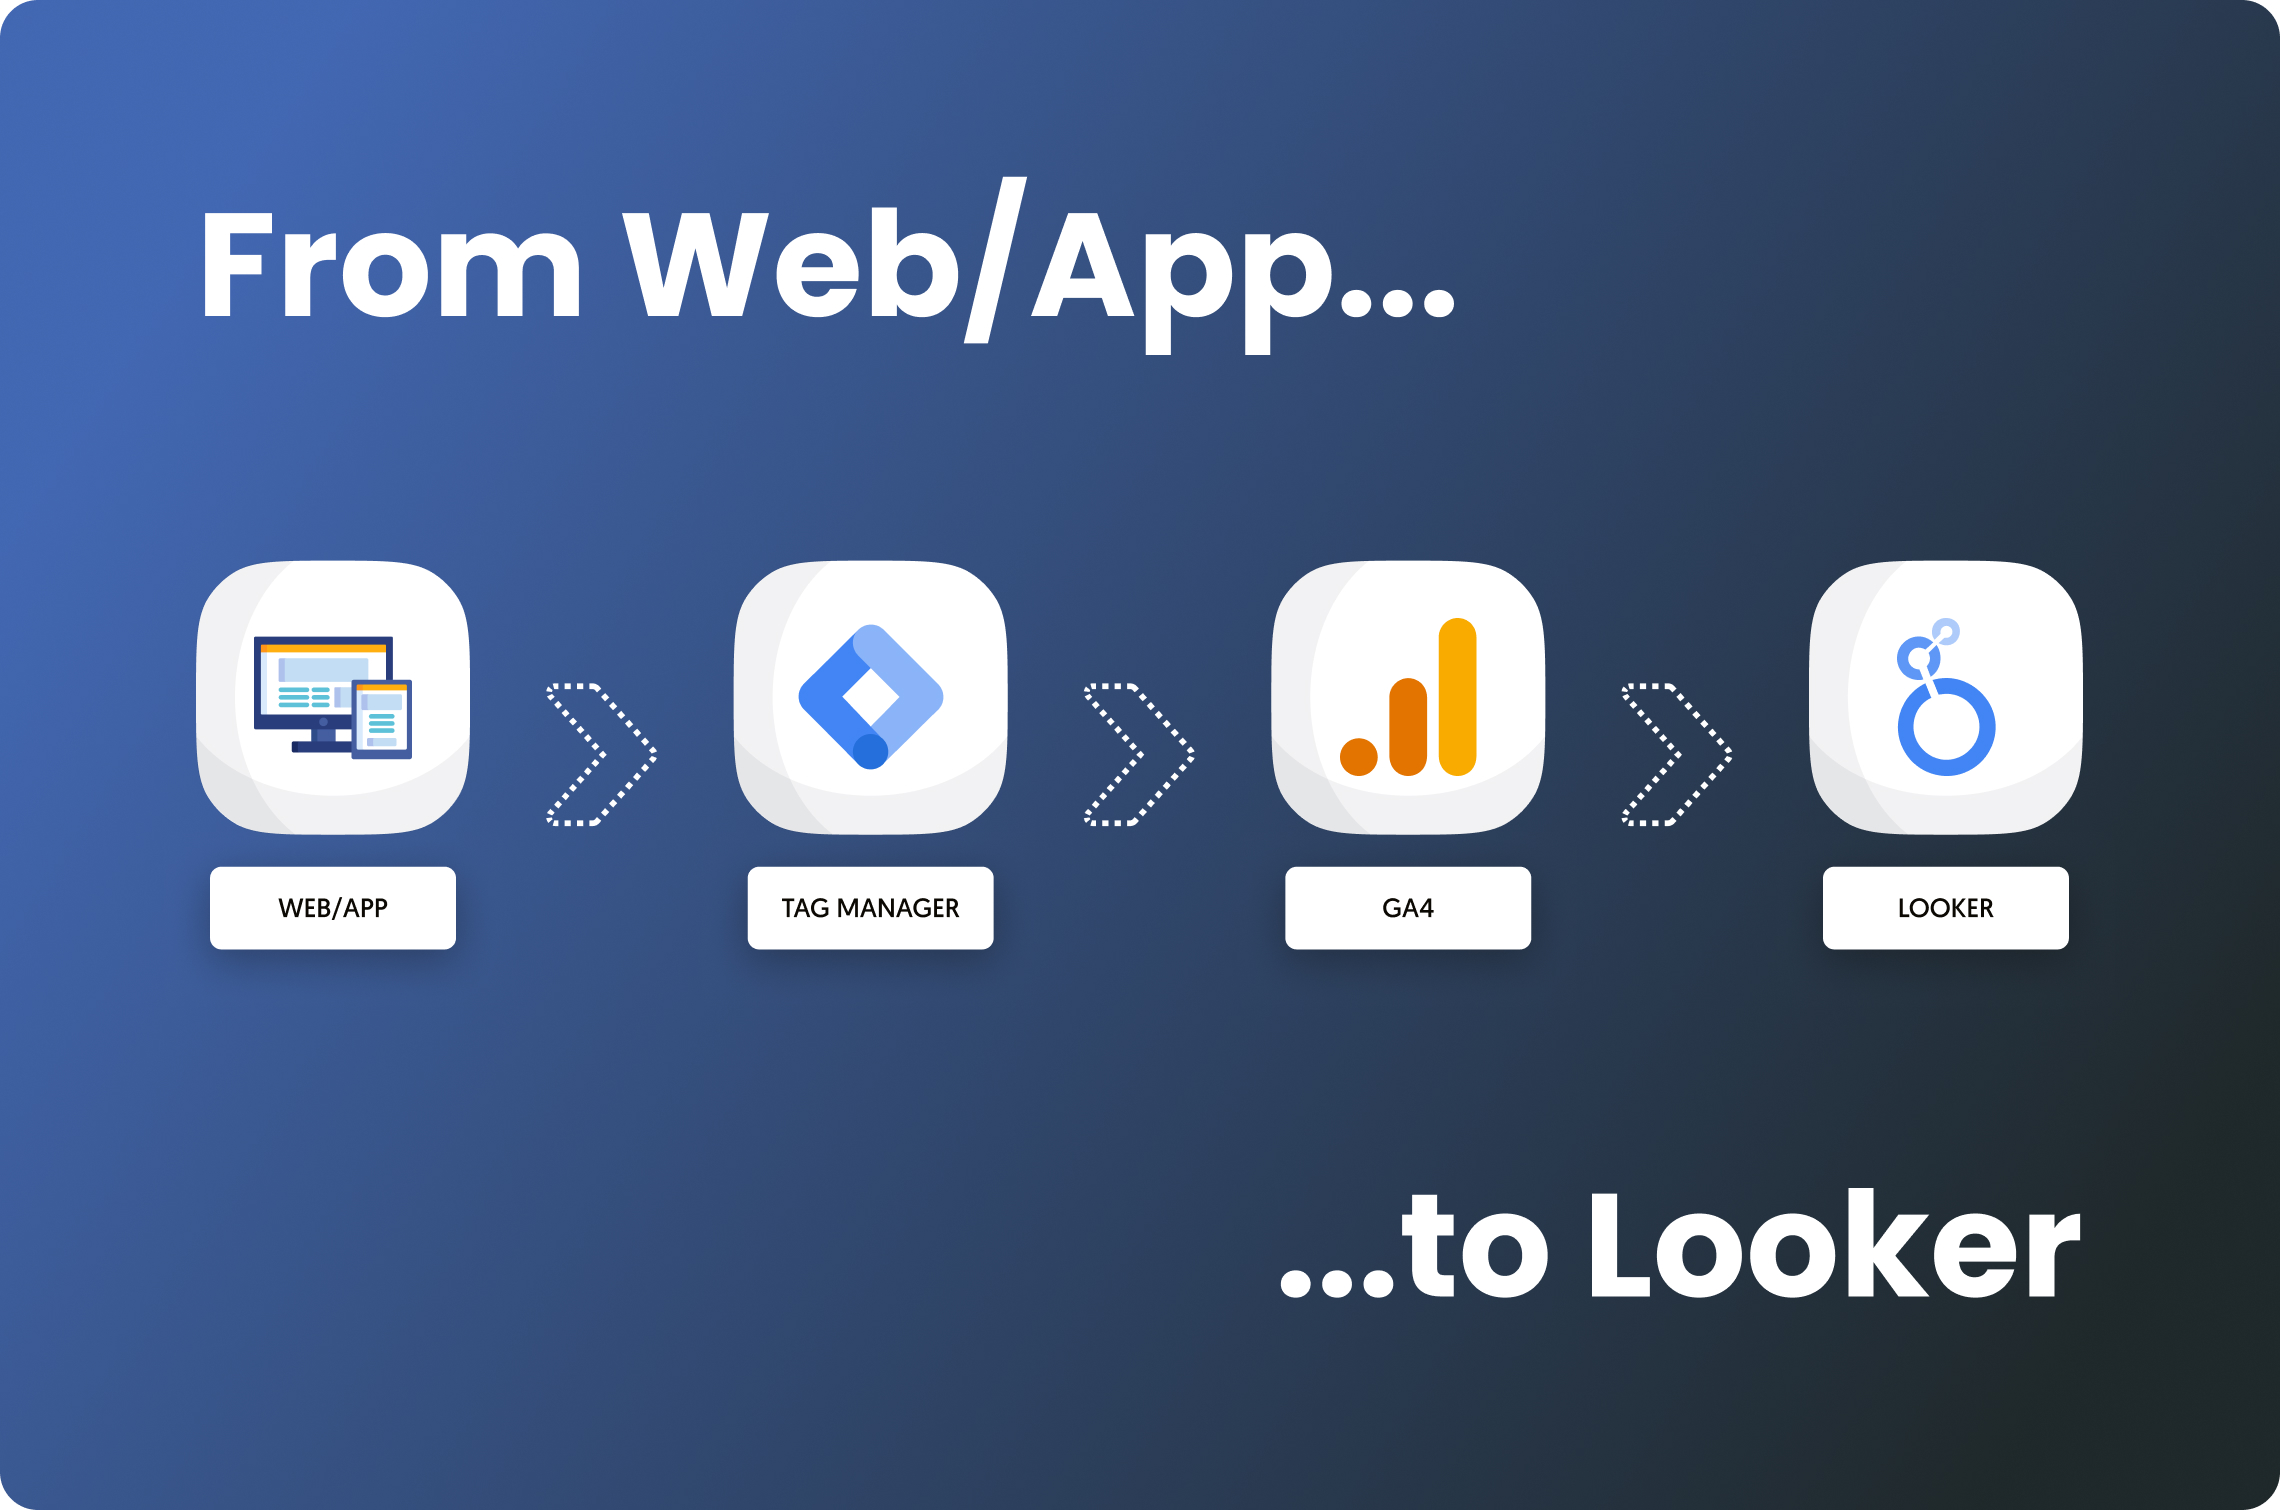
Unfortunately, you can’t send data from your app or website directly to Looker; you’ll need to have a couple of intermediary tools in place to get it there.
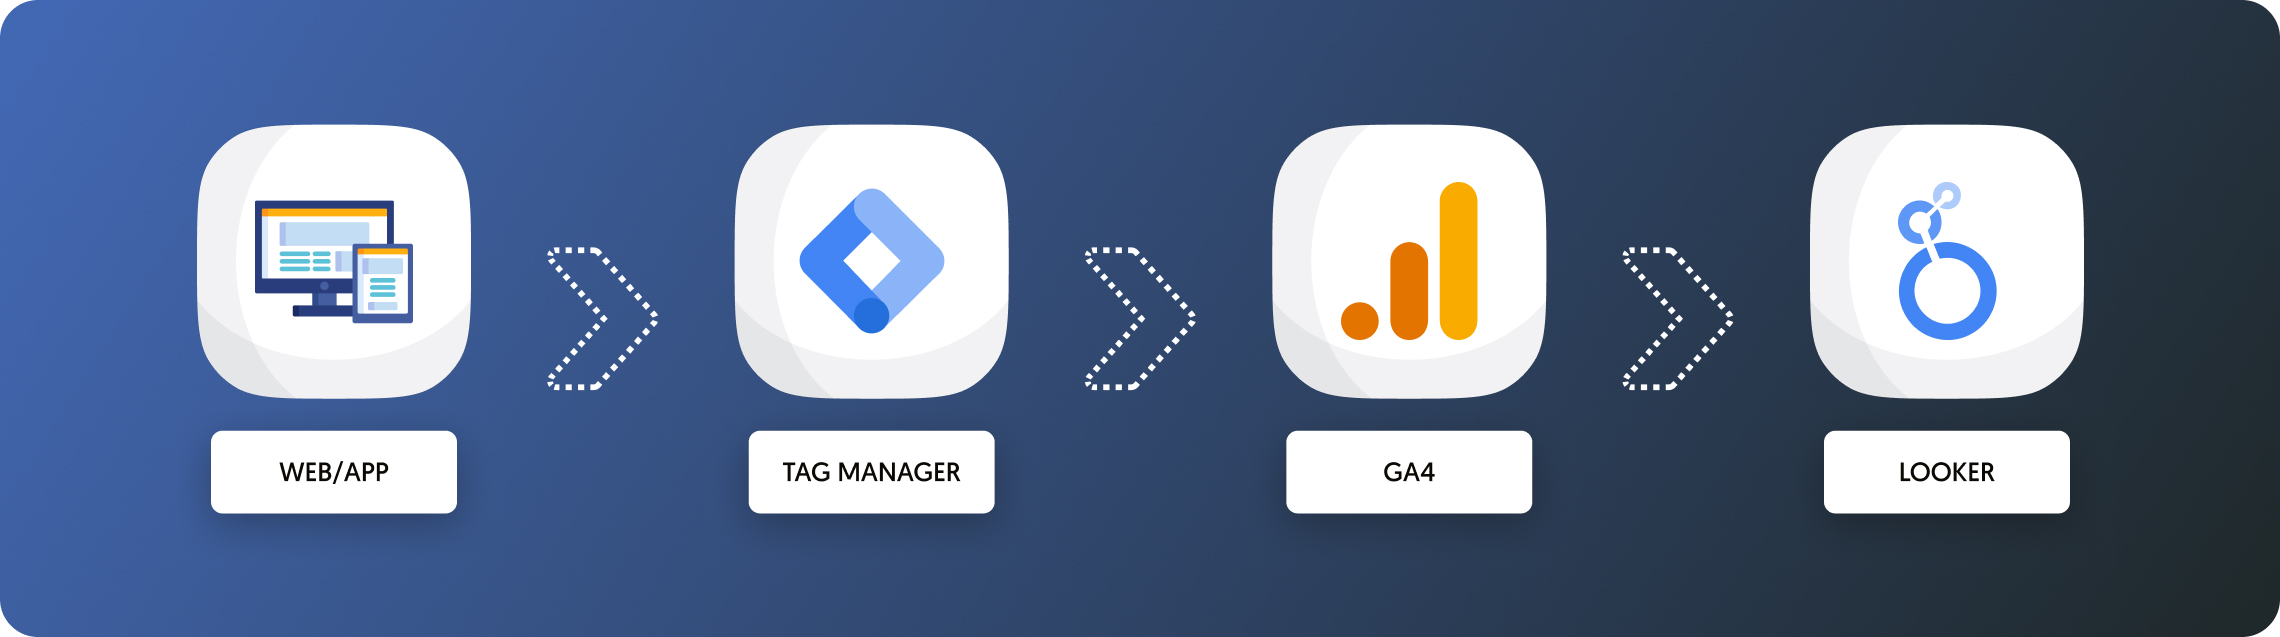
The first of these tools is Google Tag Manager (GTM). Think of GTM as a robot that pulls data from your app or website and stores it in a bucket.
Next, of course, you’ll need a bucket, which is Google Analytics 4 (GA4).
Lastly, you can either take this bucket yourself and dump it into Looker Studio, or you can program another robot (i.e, a data integration tool like Dataddo) to do it for you. We’ll talk more about each method later.
Before we start, there are three conditions that must be met:
- You must have GTM and GA4 set up and connected to each other. If you don’t, go here for instructions on setting up GA4 (you should do this first), then go here for instructions on setting up GTM. You should also have permissions to make changes in both of these apps.
- You will need to have a data layer set up on each web page where you want to track behavior. Data layers are basically shelves where GTM stores and standardizes data before dumping it into your GA4 bucket. If your website was built by developers, they’ve probably already set up data layers for you. If not, here are instructions for implementing them. If you’re not sure, you can find out by following the points in step 1 below.
- Any ad blockers or other anti-tracking systems on your device must be disabled, because you yourself will need to perform the action that you want to track, and then ensure that it was tracked correctly.
Once these three conditions have been met, you should be able to follow our example below on your own device.
*Important: It takes at least one full day for events to register in the GA4 API; so, to properly verify that your event is visible in Looker once you set everything up, you'll need a day or two.
Sending an Event Across Your Data Stack
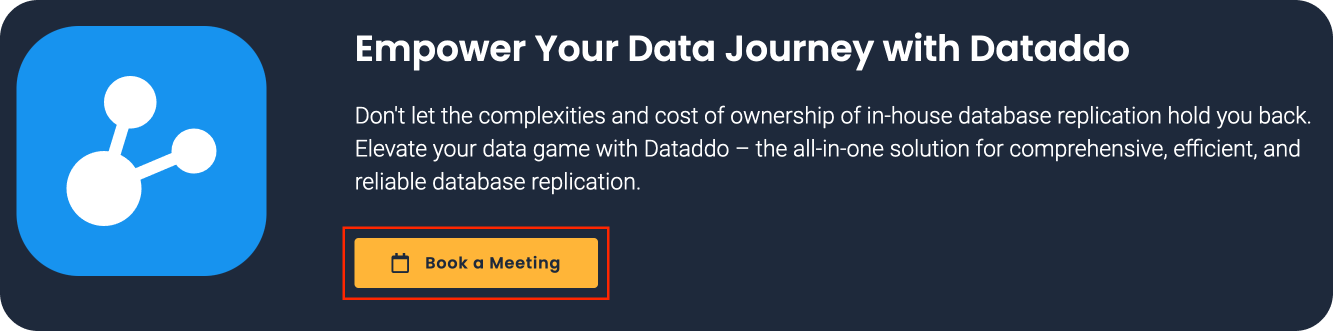
In this example, we’re going to set up the tracking of clicks on a Book a Meeting button embedded in one of our landing pages, but you could do it with any other web/app element or behavior (like time on page, scroll depth, etc.).
*Note: There is more than one way to do this, but this is the way I do it.
Step 1: Collect Reference Information from Your Website
Before we go into GTM, we need to collect some information from our landing page (or app).
- Go to the page where the button is located and click on the button.
- Right-click on the page and select Inspect.
- Navigate to the Console tab in the inspection window.
- In front of the arrow at the bottom, type in dataLayer and hit Enter.
- Unravel the line that appears under it to see all the behavior events that have just been recorded in the dataLayer.
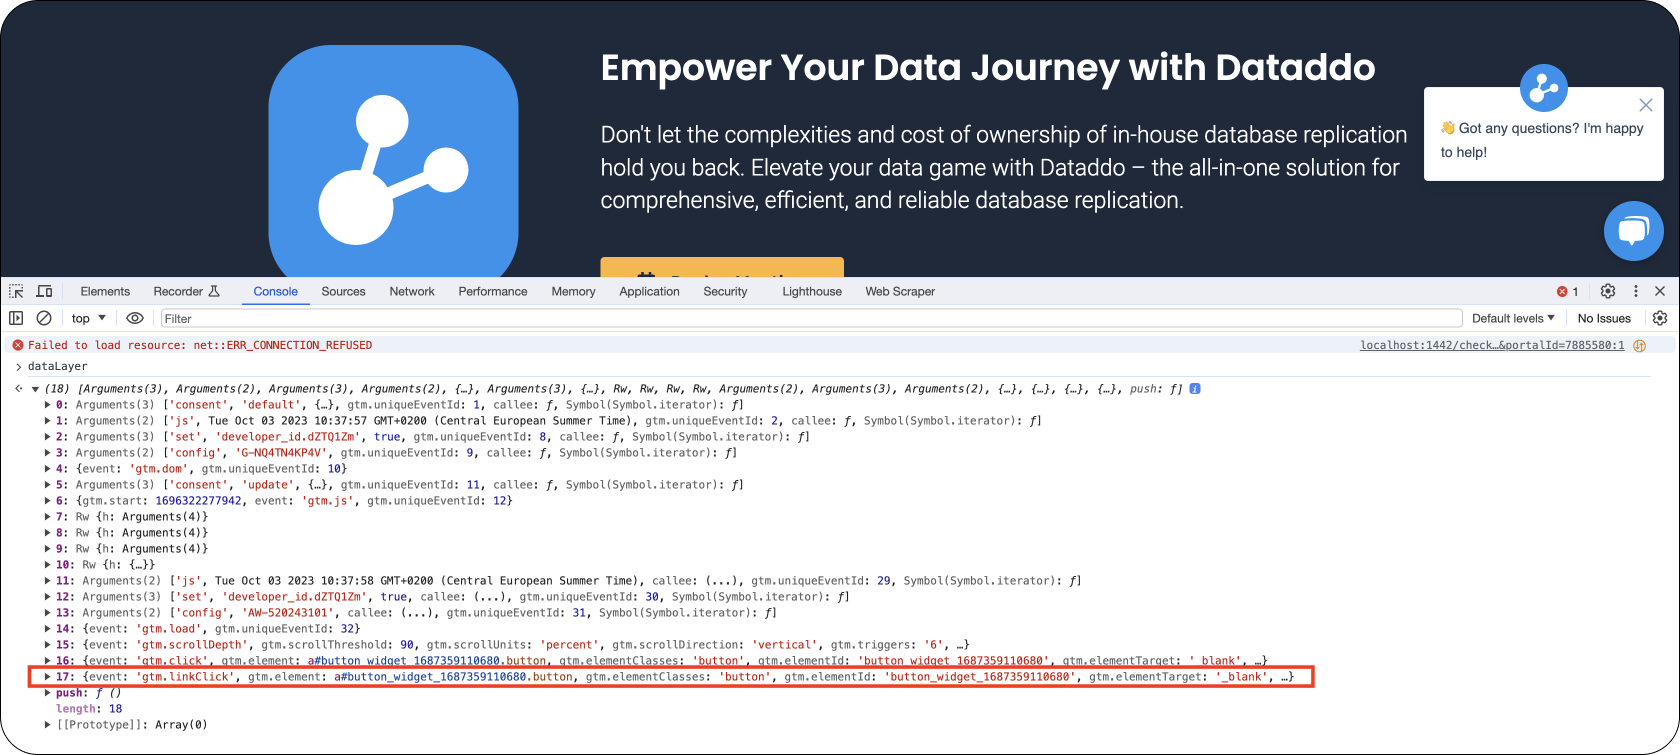
- Find the event that corresponds to your button click in step 1 (in our case: #17), then click the arrow to unravel it. The information in the gtm.elementText field is the information that you will need to configure GTM (the name of this field can vary depending on how your dataLayer is set up).
- Copy the text inside the quotes into your clipboard for the next step.

*It’s worth mentioning that dataLayers don’t always work perfectly. For example, you may need to click a few times in order for an event to register.
Step 2: Create a Trigger and Its Variables in Google Tag Manager
Now, open GTM. We are going to create a trigger that fires every time our button is clicked. But, before we create the trigger, we should create variables (i.e., the conditions under which it fires).
Create Your Variable(s)
- Click the Variables tab in the left menu.
- In the User-Defined Variables section, click New.
- Under Variable Configuration, click Auto-event variable.
- Select Element Text as the variable type, then name it and save it.
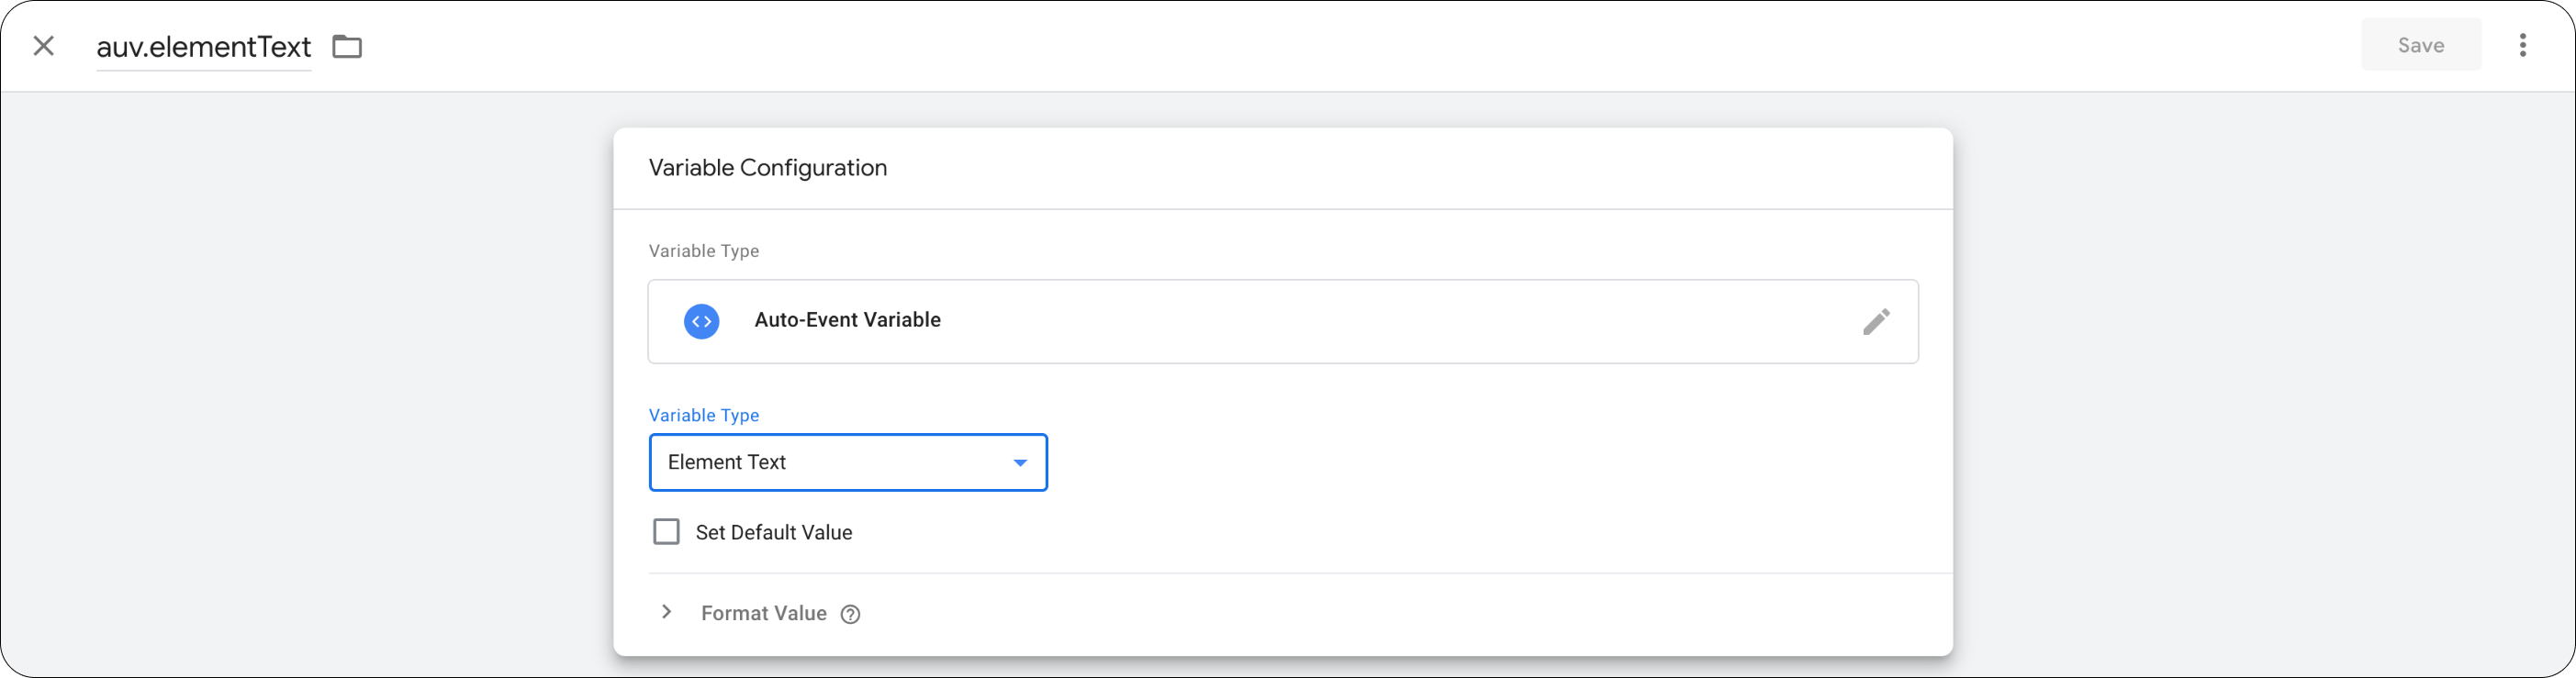
We will now use this variable to stipulate that the trigger should fire every time the button that has the "Book a Meeting" text is clicked.
Create Your Trigger
- Click the Triggers tab in the left menu, then click New.
- Name your trigger.
- Choose your trigger type. In this example, we are going to choose Click - All Elements.
- I want this trigger to fire only in response to certain clicks (as defined in the fields below), so I am going to select Some Clicks.
- Paste the information you copied from the gtm.elementText field in the previous step into the auv.elementText field in the trigger configuration popup box (auv.elementText is our naming convention; yours may vary).
- Paste the page URL in the Page URL field.
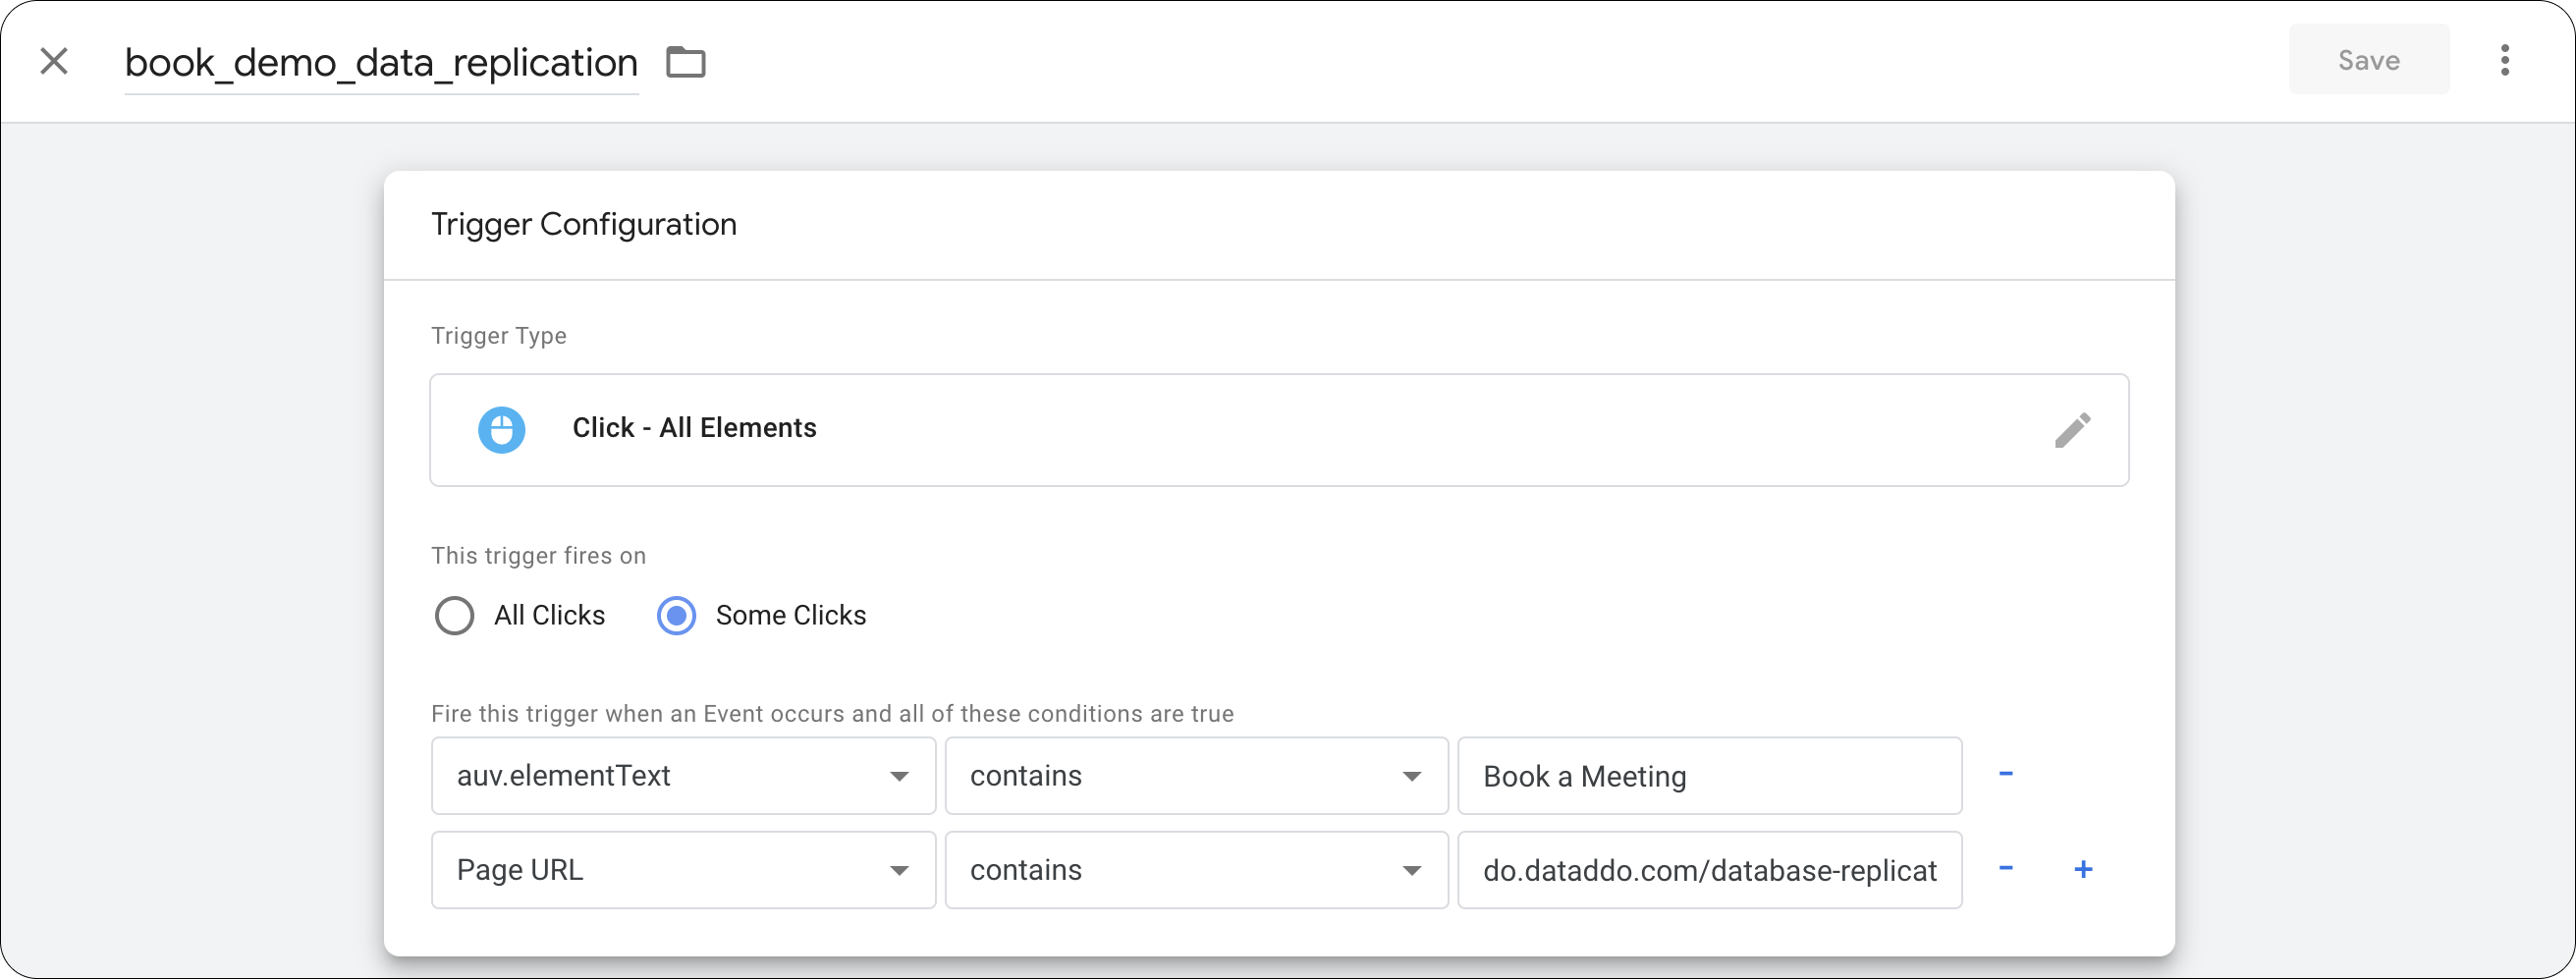
Now, we have a trigger configured to fire anytime anyone clicks on the "Book a Meeting" button on this particular landing page.
Step 3: Create a Tag in Google Tag Manager
Once the trigger you created is fired, the data for that event is collected in the dataLayer. But then what? Tags tell GTM where to send the data next.
- Go to the Admin section -> Data Streams and copy your GA4 measurement ID into your clipboard.
- Go back to the main view and click the Tags tab in the left menu, then click New.
- Choose Google Analytics: GA4 Event as the tag type.
- Name the event.
- In the box below, select the trigger that you’ve just created.
- Name the tag and save.
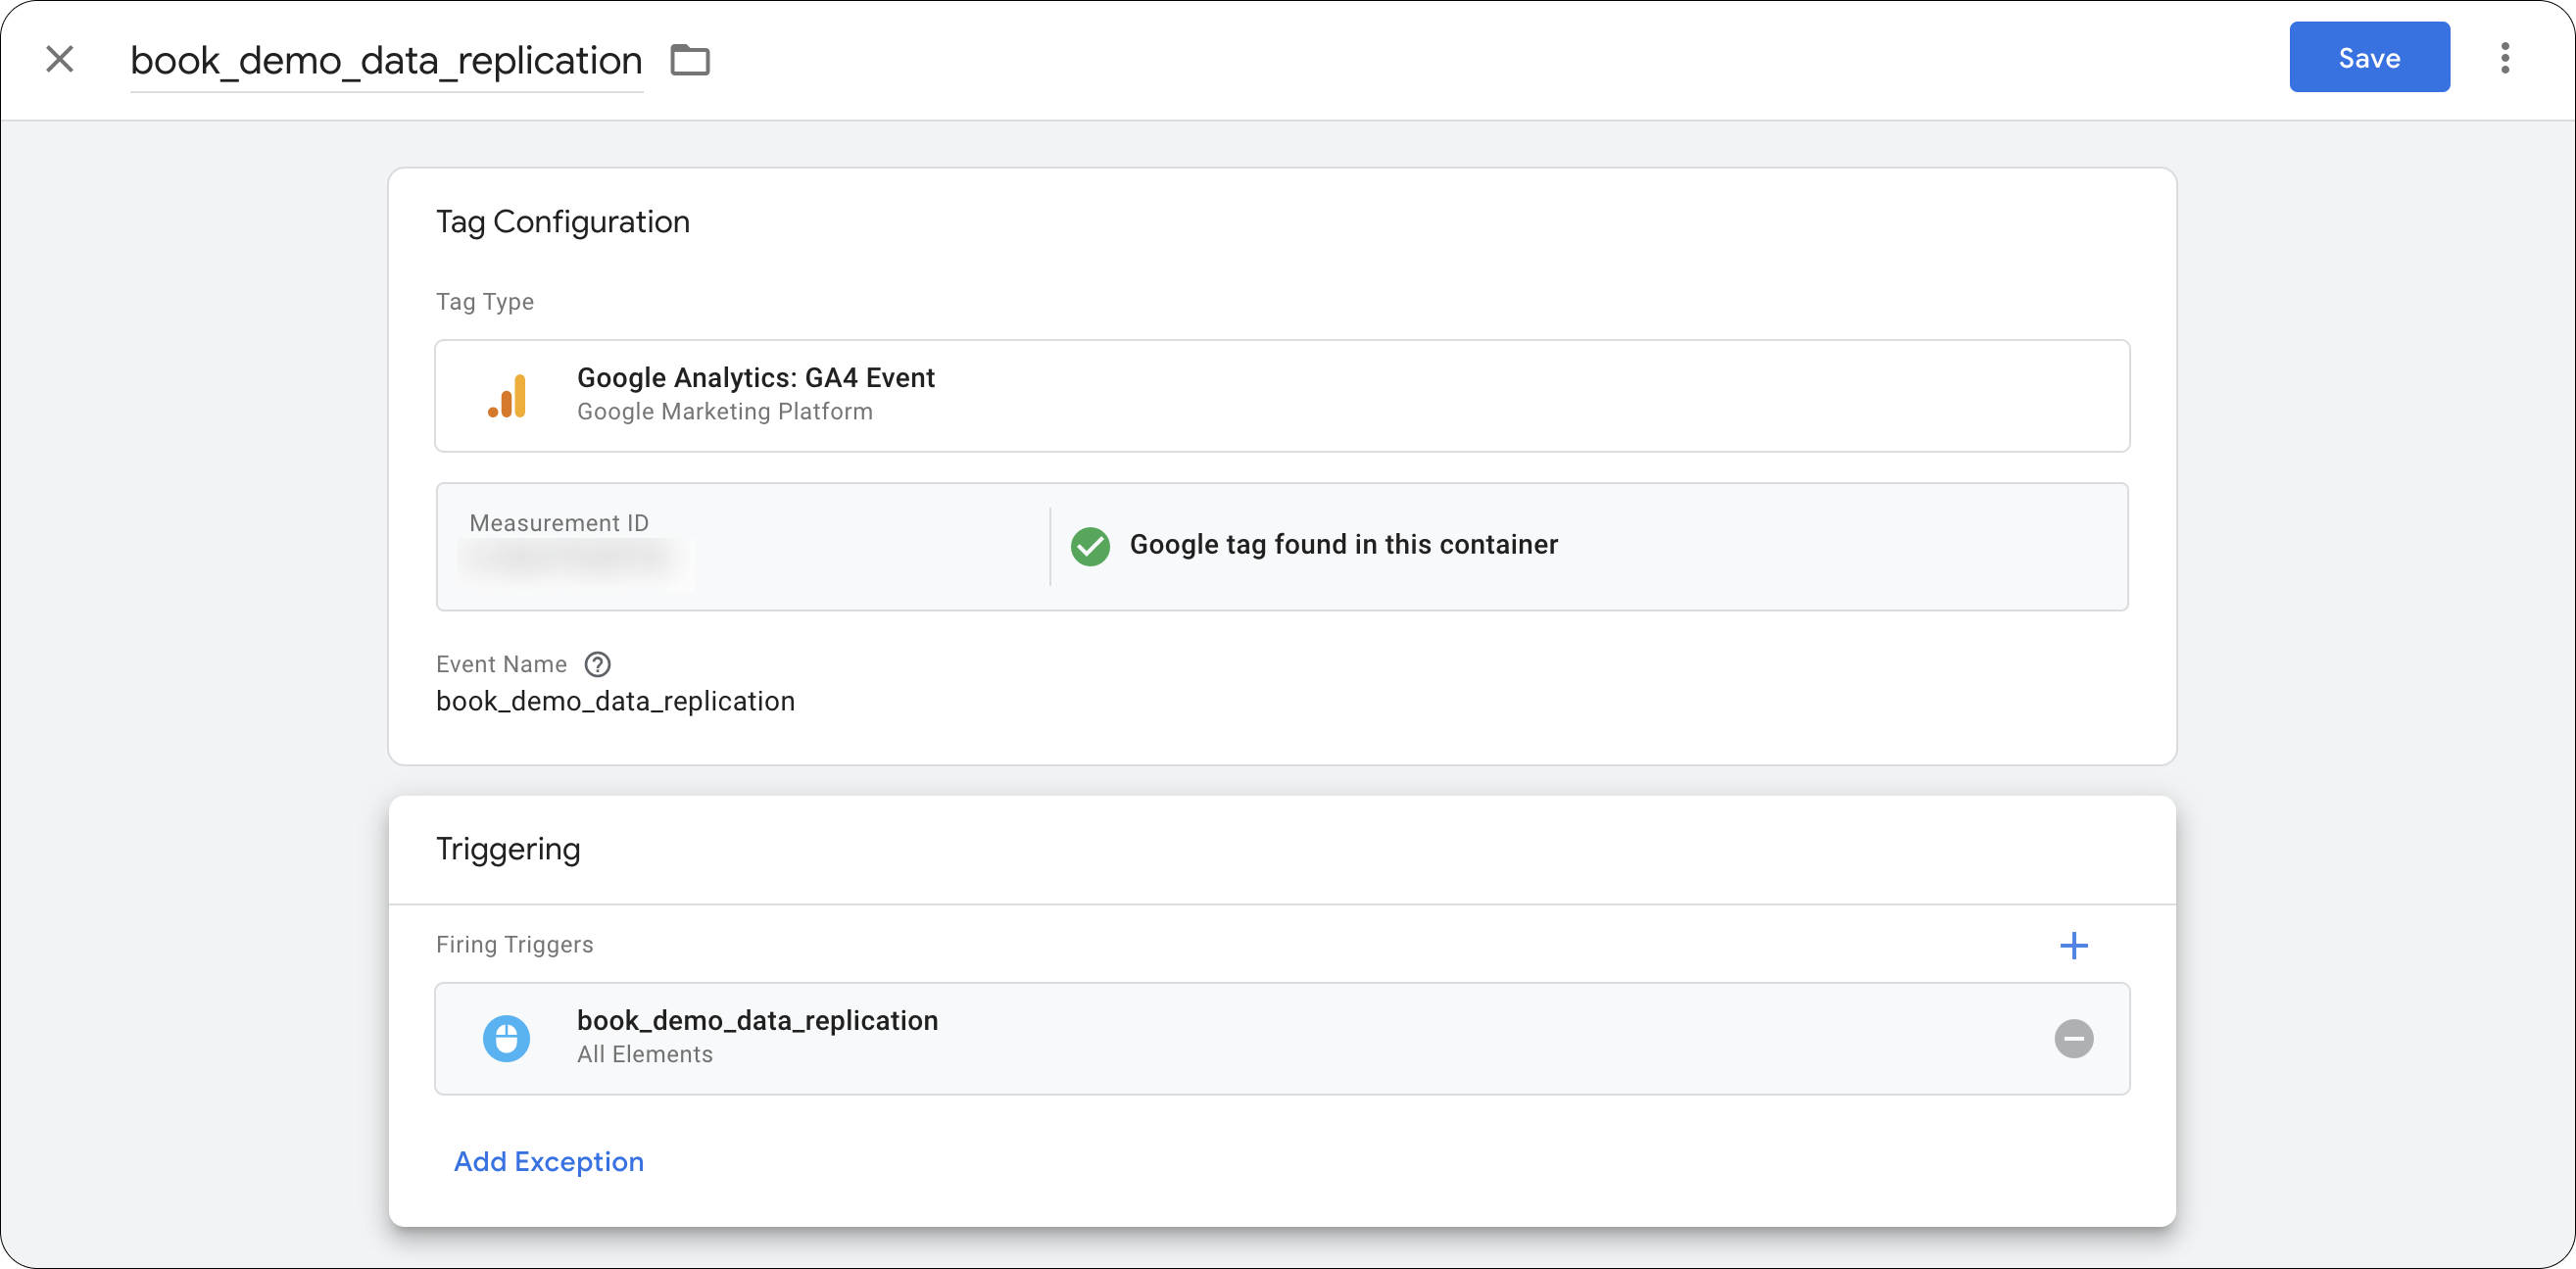
Now, GTM knows what to collect, under what conditions to collect it, and where to send the data once it’s been collected.
Step 4: Preview Your Trigger and Tag to Make Sure They Work
Once you’ve saved your tag, you should see one change in the Workspace Changes section at the top right of the main screen.
- Click the Preview button at the top right of the main screen.
- In the Tag Assistant popup, enter the URL of the landing page with the button and click Connect. A "GTM debug" version of your landing page should open in a new window.
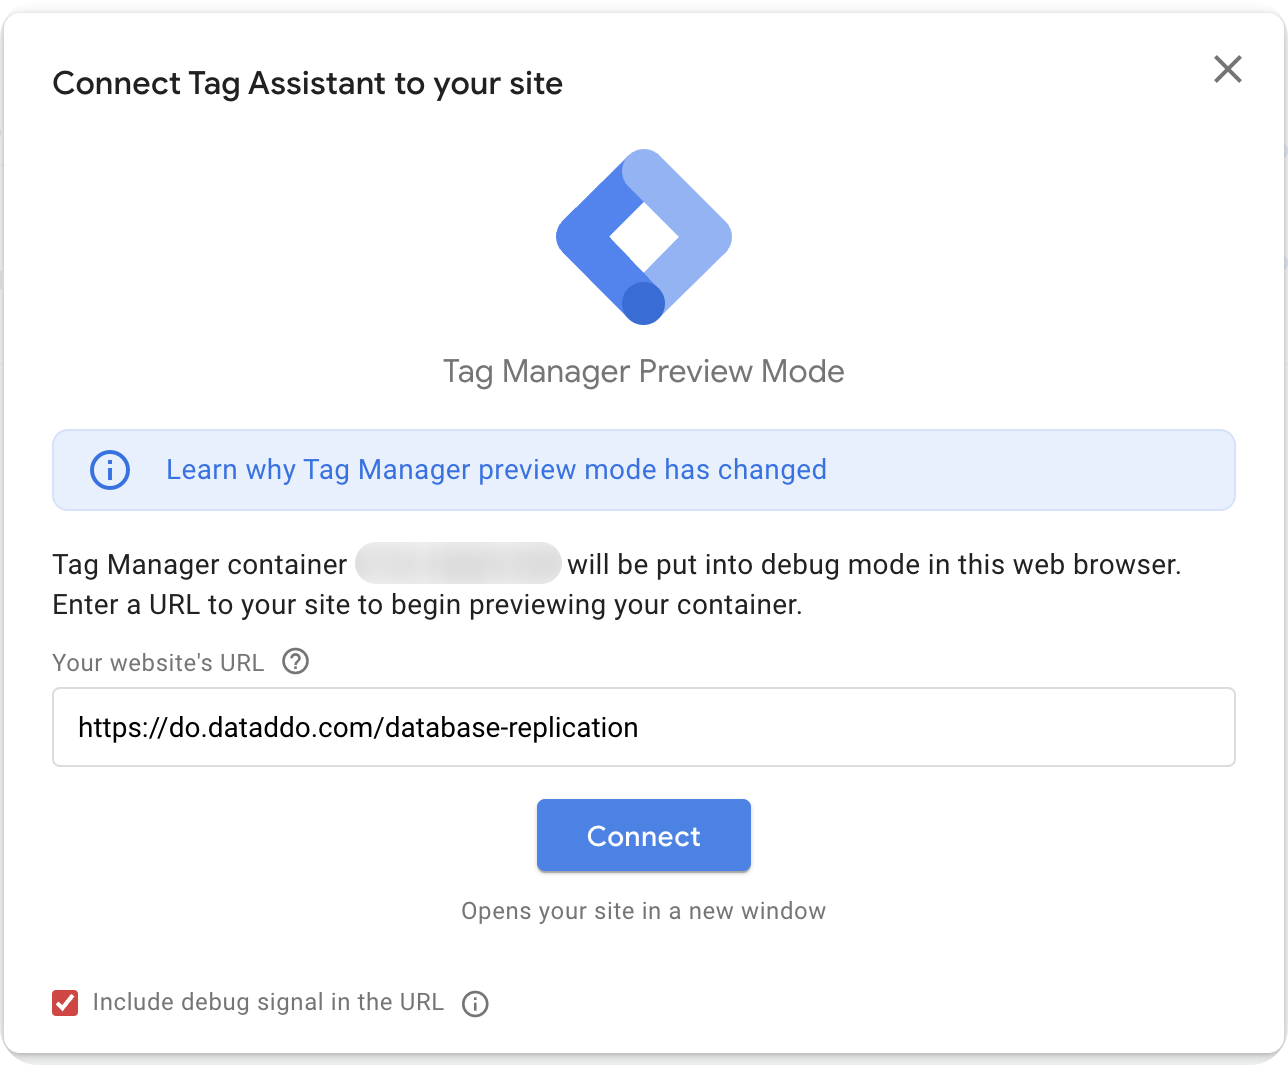
- Navigate to the button on your landing page and click it.
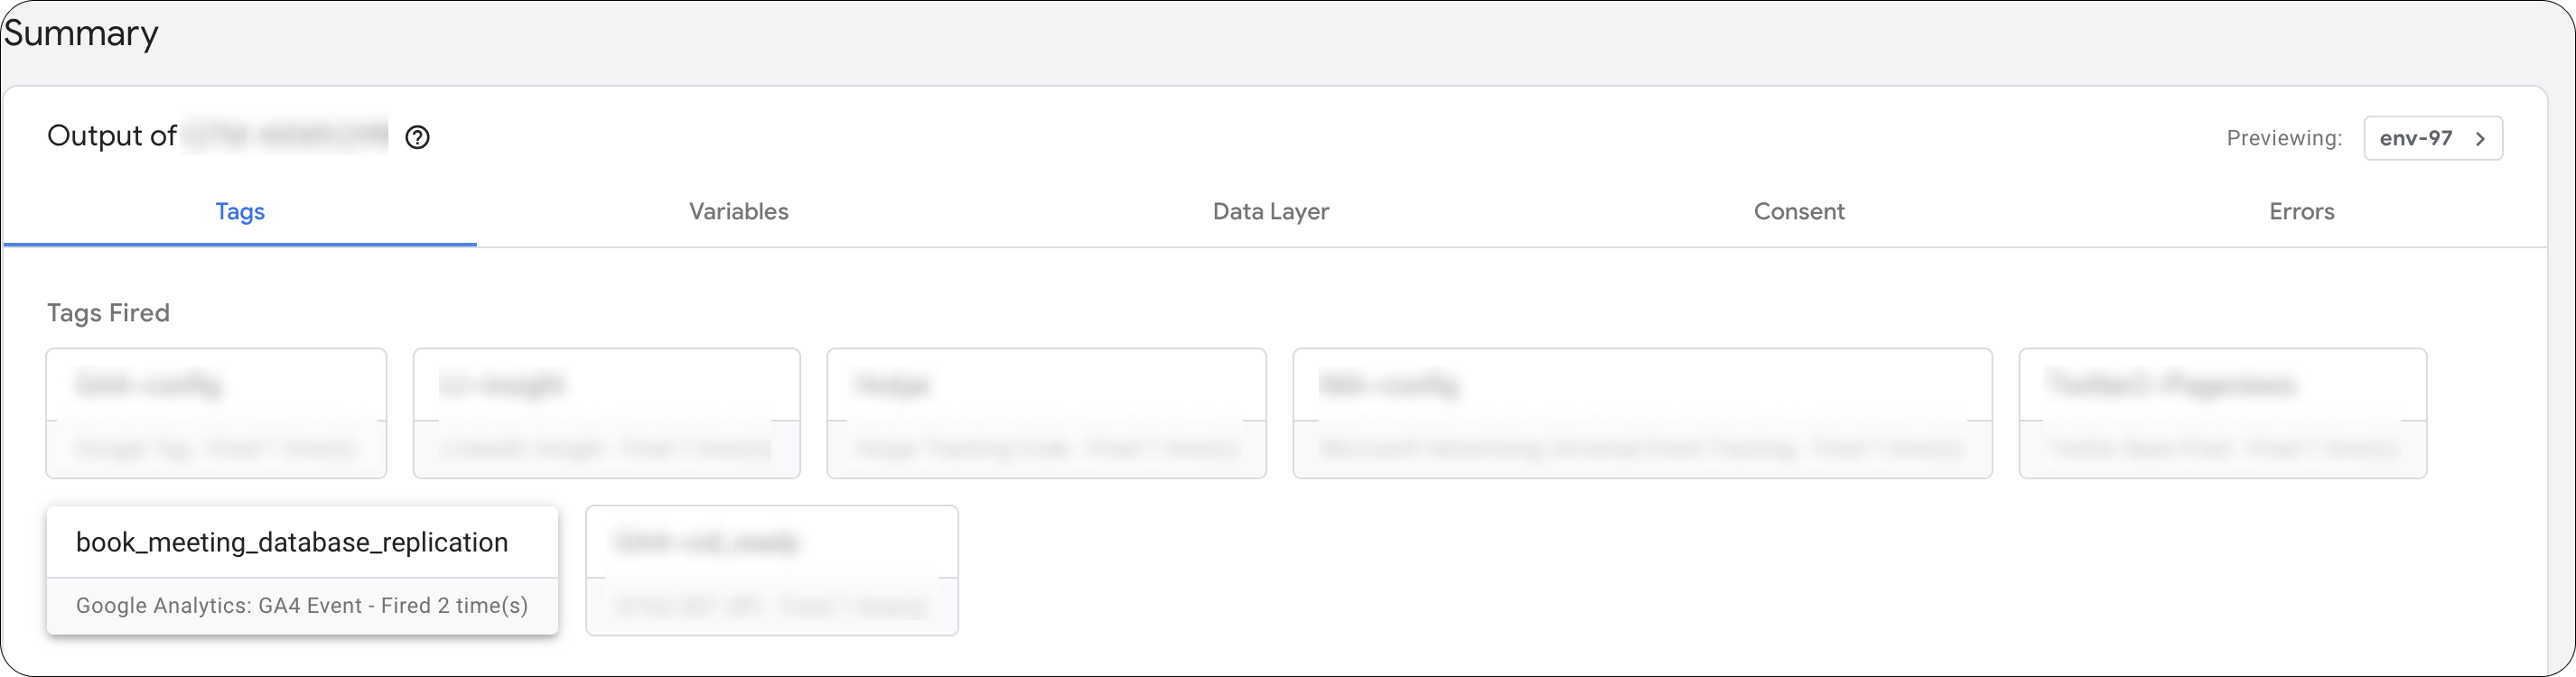
- Go back to the Tag Assistant screen and you should see in the Summary section that the click event has just been tracked.
- Assuming everything has worked correctly, go back to GTM and click the Submit button at the top right.
- Fill in the Version Name and Version Description fields (this will help you remember what you were trying to do, in case you ever need to go back and make changes).
Step 5: Configuring Google Analytics 4 to Receive the Event
Give yourself a pat on the back—you’ve made it through the “hard” part. Here’s what to do next:
- Go to the Events tab in the Admin section of your GA4 account.
- Click Create event. Then click the Create button in the upper right.
- Fill in the Custom event name field.
- In the Value field, enter the same name you gave the event in step 3, point 4.
- Click Save to close.

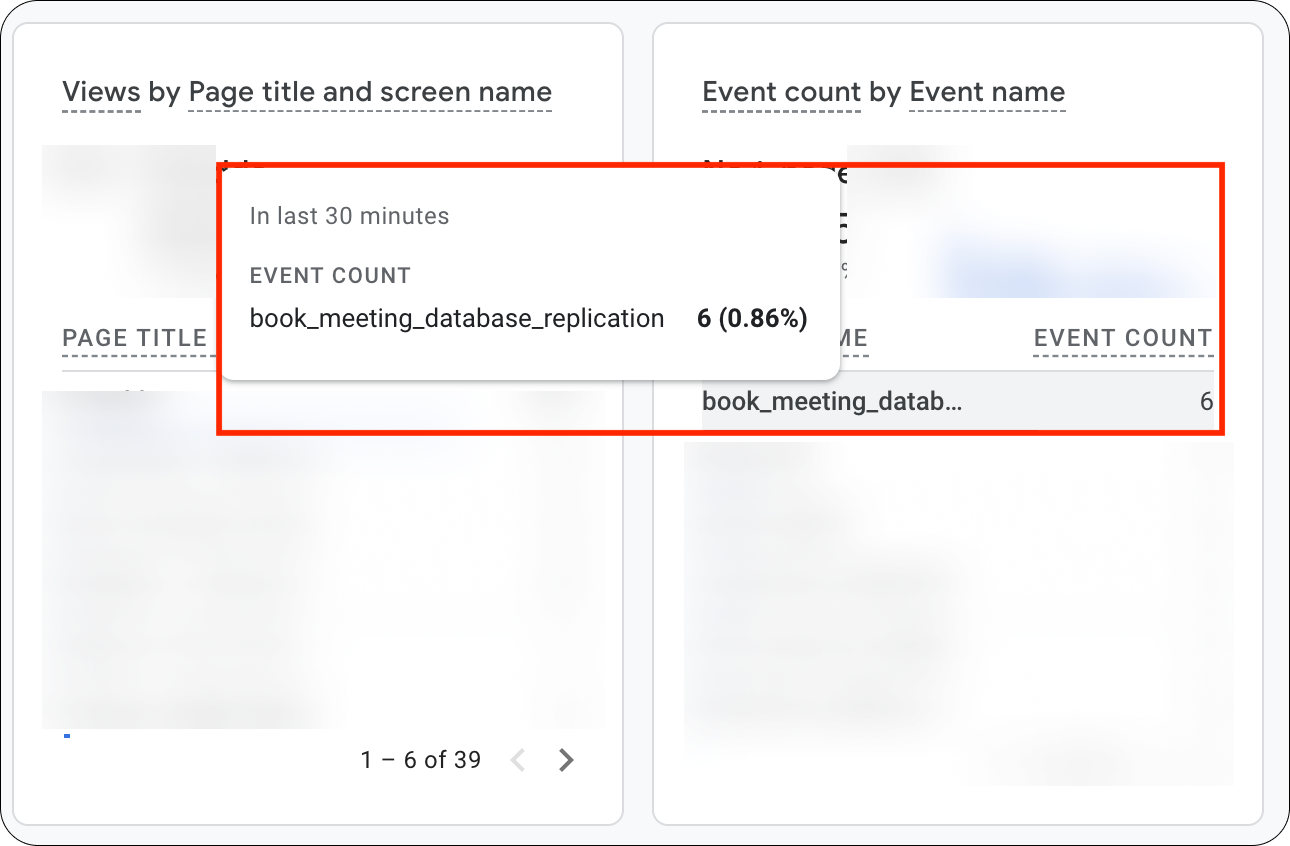
Now, if you want to actually see the event in GA4, go to Reports -> Engagement -> Events.
Here, you can do all kinds of further customizations, like add demographic dimensions, geographical information, or device information.
Keep in mind that the event can take anywhere from a few minutes to a few hours to appear on the Events screen (and, as we mentioned at the beginning, a full day or more to register in the API). If you want to see your event immediately in GA4, go to the Real-time tab.
Step 6: Getting the Data into Looker
It is, of course, possible to natively connect GA4 to Looker. But Looker’s native GA4 connector tends not to be up to date with all the metrics and dimensions in GA4.
Since Dataddo is forever-free, reliable, and capable of easily connecting GA4 to Looker, we’re going to use this connection method.
If you’ve never used Dataddo before, sign up for a free Dataddo account here.
- Under the Sources tab, click the Create Source button and select our GA4 connector from the list.
- Click on Add New Account at the bottom of the drop-down and follow the on-screen prompts.
- Name your data source and select your metrics and attributes. Metrics for the Google Analytics event you just created should be immediately available (see screenshot below).
- Click Next to choose your snapshotting/sync frequency. Of course, you’ll want to see your data ASAP in Looker, but remember that it takes a day or two for events to register in the GA4 API; so, to properly test that everything works, you'll need to wait a day or two after setup. You can also load data manually at any moment using our Data Backfilling feature.
- Preview your data by clicking on the Test Data button in the top right corner.
- Click Save and your new data source is ready!

If you get stuck for some reason, see our GA4 connector documentation. Then, connect your GA4 source to Looker Studio with the following steps:
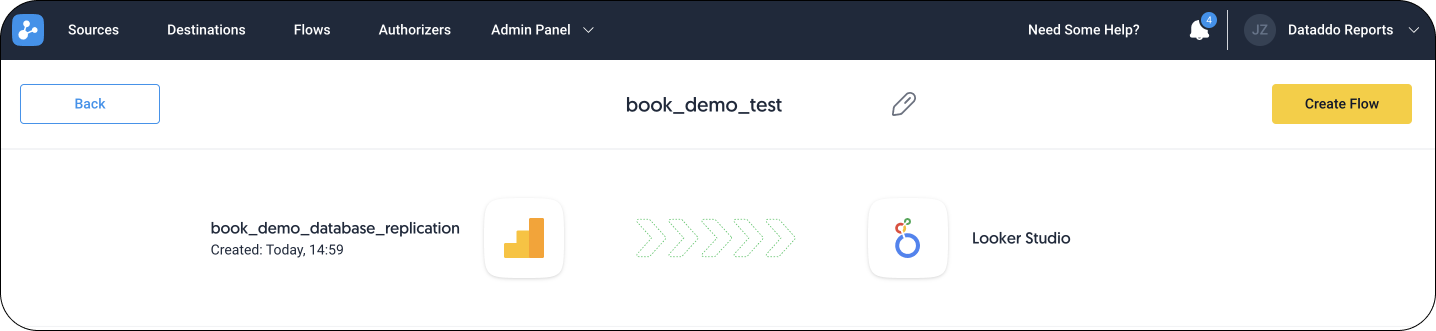
- Navigate to Flows and click on Create Flow.
- Click on Connect Your Data to add your GA4 source.
- Click on Connect Your Data Destination, navigate to the Dashboarding Apps, and select Looker Studio.
- Check the Data Preview to see if your data is correct.
- Name your flow, and click on Create Flow.
- A window with configuration details will pop up. Follow the instructions to finish the setup in Looker.
If you get stuck, see our Looker Studio connector documentation.
Working with Data in Google Looker Studio
At this point, seeing your event data in Looker will simply be confirmation of correct setup. To make your data actionable, you’ll need to wait to see how it evolves over time, as well as combine it with other data. You could, for example, start collecting data on visits to the page where your button is, and then divide the number of button clicks by the number of visits to get a conversion rate. The possibilities are nearly endless.
Read our blog for other Looker Studio templates, tips, and tricks. Or join the Dataddo Slack community, where you can get answers to questions from other users of the Dataddo platform, as well as access more free resources to help you work with data.
|
Connect All Your Data with Dataddo Just a few quick steps to get your data to your dashboard for better analysis, without the hassle.
|


Comments