
Taking charge of your eCommerce data may seem a daunting task, but it doesn’t have to be. Focus on creating a composable data infrastructure that can adapt and change with your business and your knowledge level, and the pressure comes off immediately.
A solid architecture not only utilizes data directly from your shop, but interweaves it with your other cloud applications in marketing, shipping and refunds, customer service performance, etc., giving you the most comprehensive view of how your customers interact with your store. It utilizes the data warehouse and/or business intelligence tool that is best suited to your use case. The end result: you feel empowered to make data-driven decisions for your business.
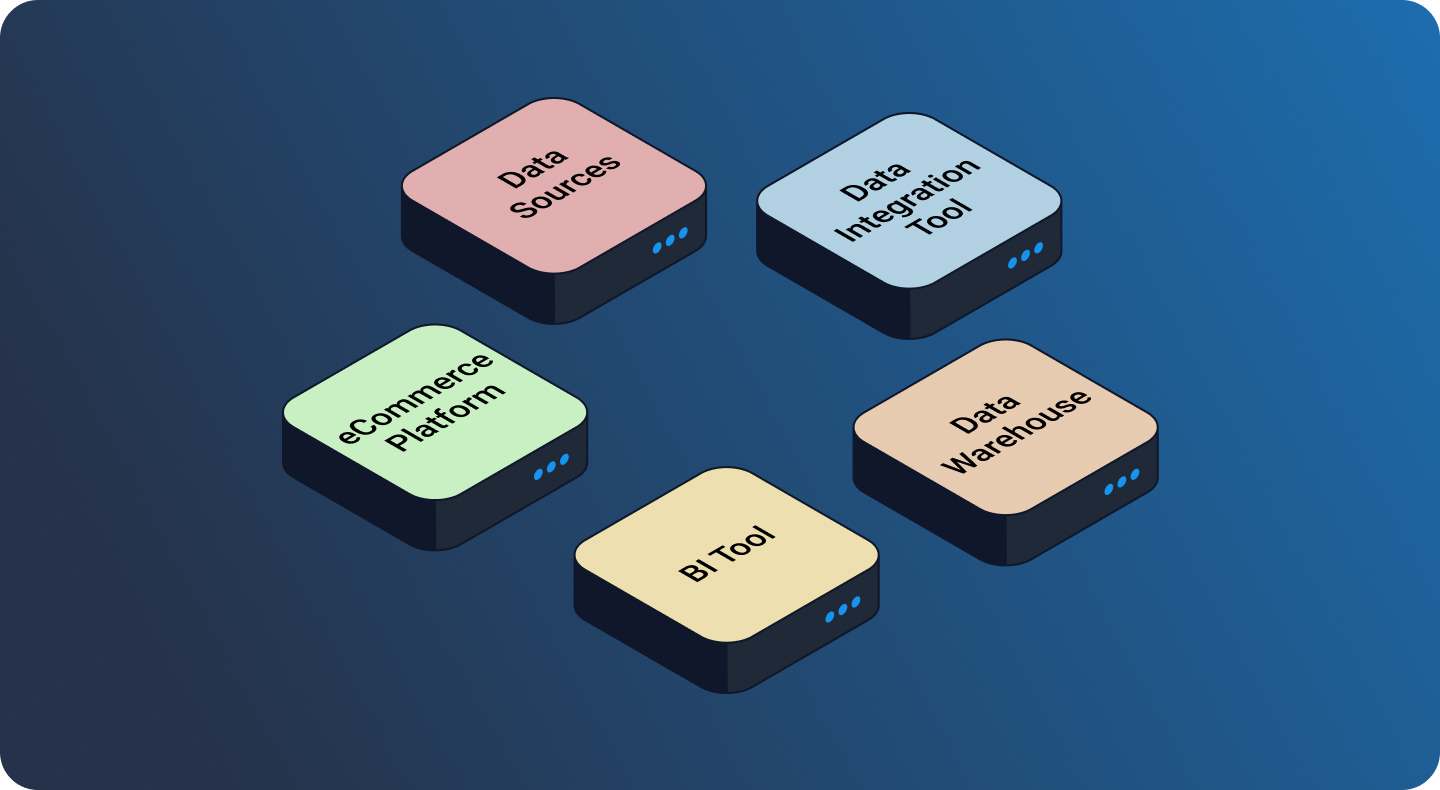
This article will cover the first steps to kick start your eCommerce architecture. Before we get started, remember that at its most basic, the components of your eCommerce infrastructure should include:
- The eCommerce platform itself
- Related data sources (social media, Ads accounts, customer service, etc)
- Data integration platform
- Data Warehouse
- Business Intelligence tool
1. Define the data you need
2. Improve your data collection
3. Choose where to send and store your data
4. Move data to your destinations
5. Transformations
6. Building your dashboards
With these elements in mind, you can tackle the process of building your eCommerce infrastructure.
1. Define the data you need
Before doing anything else, it’s important to know what metrics and data types you want to gather to inform the other elements of the architecture. While you probably don’t need to go so far as creating advanced data models (yet), you should take a hard look at all of the cloud applications you use.
Within your eCommerce platform: how detailed do you want to get with your customer data? Will you take only the general information on each order or will you dive into line items? There are hundreds of possible metrics you can take into account, but as an example, here are some common metrics used for both Customers and Orders:
|
Customers |
Orders |
|
|
Created at |
|
Address |
Order ID |
|
Gender |
Currency |
|
Age |
Payment Gateway |
|
Total Spent |
Fulfillment Status |
|
Orders Count |
Landing Site |
|
Marketing Opt-in |
Processed at |
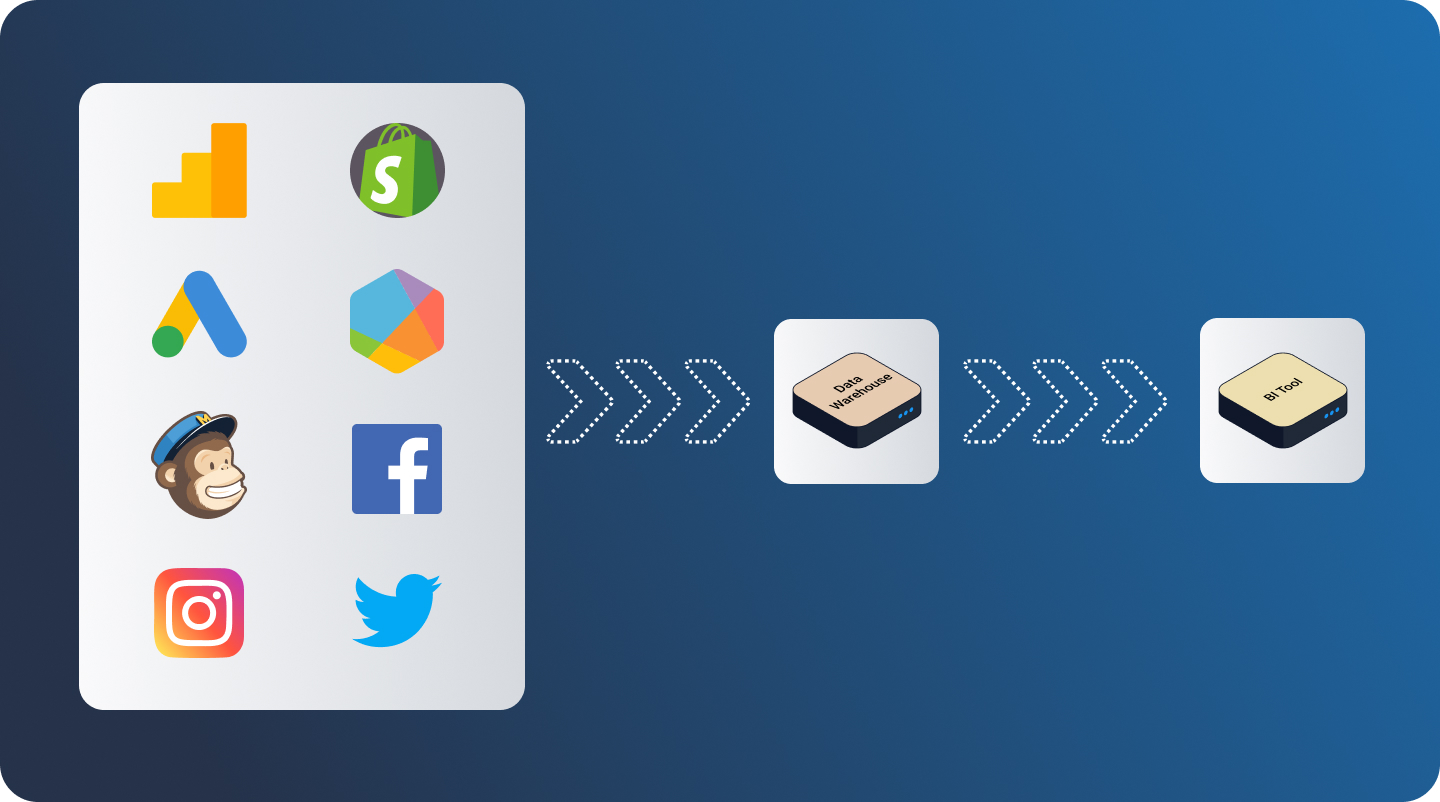
Then, looking outside of your eCommerce: choose the additional applications whose data will best support the picture you are trying to build of your business operations. Common apps include:
- Advertising (Google Ads, Facebook Ads, Instagram Ads)
- Organic socials (Facebook, Instagram, TikTok)
- Customer Service (Zendesk, Freshdesk)
- Financials (Xero, Rebound Returns, Quickbooks, Stripe)
- Other customer data (Salesforce, Mailchimp)
Tip: You don’t only need to use data coming directly from your applications. Outside market data is widely available and is extremely valuable to add to the mix. You can compare your prices to your competitors, the general demand for brands you carry, and more. Try comparison shopping engines, Google Merchant Center, Cint, or social listening tools like Brandwatch or Sprout Social for additional data to give your insights an edge.
2. Improve your data collection
Let’s paint a picture—A typical buyer journey (once they find your business) might look like this: they start on the Category page, as most will. They filter products > view products > add to cart > remove from cart > abandon cart > come back a few days later > edit cart > purchase > contact support > return an item > receive a refund. Tracking the details of each of these steps is vital to finding issues with your website and uncovering hidden gems that will boost your growth and revenue.
If you use Google Analytics for example (and the chances are high that you do), you already have access to pretty sophisticated eCommerce tracking. However, implementing something like dataLayer can help you give Google Analytics a boost.
Jan Felt from CyberFootprint suggests dataLayer is the real secret to better data collection. He explains that dataLayer filters information from your website into a Google Tag Manager container. It is completely flexible to your needs and can consolidate data from any aspect of your customer’s buying process.

You’ll want to be sure to collaborate closely with your website’s front-end developers to implement dataLayer, but you can also find comprehensive guides on implementing dataLayer and Enhanced Ecommerce. If you’re running a Shopify store with a small tech team in-house, you can follow the Analyzify guide for dataLayer and GTM for Shopify.
3. Choose where to send and store your data
BI Tools can help you produce flashy reports, but don’t let this distract you: the importance of choosing the right data warehouse cannot be understated. When managing the data for an e-shop, you want to have access to all of your data from the beginning of time to reflect changing customer behavior, customer loyalty, trends, etc. A warehouse will let you store, access, and transform this data with ease (more on that in Step 5), while a business intelligence tool can’t provide these functionalities to any degree. Most BI tools are even quick to break down when overloaded with millions of rows of data, which makes buffering this data in your warehouse even more crucial.
But not all data warehouses and BI tools are created equal. Choosing the right destination depends on the amount of data you collect, how you want to implement it, your level of data expertise, and the tech systems you already use in your company.
As an example when comparing warehouses, we’ll mention just a couple of players on the market: Google BigQuery and Snowflake.
Price: BigQuery is typically the cheaper option, especially for those with simple use cases. Plus, its extensibility with other Google Apps lends it a fair deal of ubiquity.
Capabilities: If you do decide to pay for a high-end warehouse such as Snowflake, it’s going to be for its transformational capabilities, speed, and heightened security features. However, a simple eCommerce store rarely demands hefty requirements.
Existing systems: Be sure to take stock of what applications you already use and make your warehouse decision accordingly. It’s no secret that Google apps integrate well with other Google apps, Microsoft with Microsoft, etc. If you’re already using Google Ads, Google Analytics, and Google Data Studio, your warehouse choice should be relatively easy.
And one last thing: when choosing your warehouse, do yourself a favor and make it cloud-based. For more information on this topic, see our blog about the best cloud data warehouse solutions and how to choose the right one.
4. Move data to your destinations
Moving your data from source to destination requires you to build a data pipeline: an automated connection between source and destination that moves your data at specified intervals. Building quality pipelines ensures that the data in your warehouse and dashboard is always up-to-date and saves you countless hours otherwise spent moving data manually.
Key considerations when setting up your data integrations:
- Historical data: How much past data do you want to load at the start? Months? Years? All-time? Favor loading as much data as you realistically can to give you the best picture of your customers.
- Sync frequency: How often do you want new data to be sent from source to destination? In most cases, once per day suffices, but some large corporations with massive data loads choose hourly syncs, or even more frequently.
- Which data: You probably won’t need every single metric that every single connector has to offer. Use discretion when choosing the most relevant metrics to avoid cluttered dashboards.
- How the data will be updated: Different data writing strategies are often used when loading data to a warehouse or dashboard. We recommend using one like Upsert (a portmanteau of “update” and “insert”) which updates past records as it inserts new ones, avoiding duplicates.
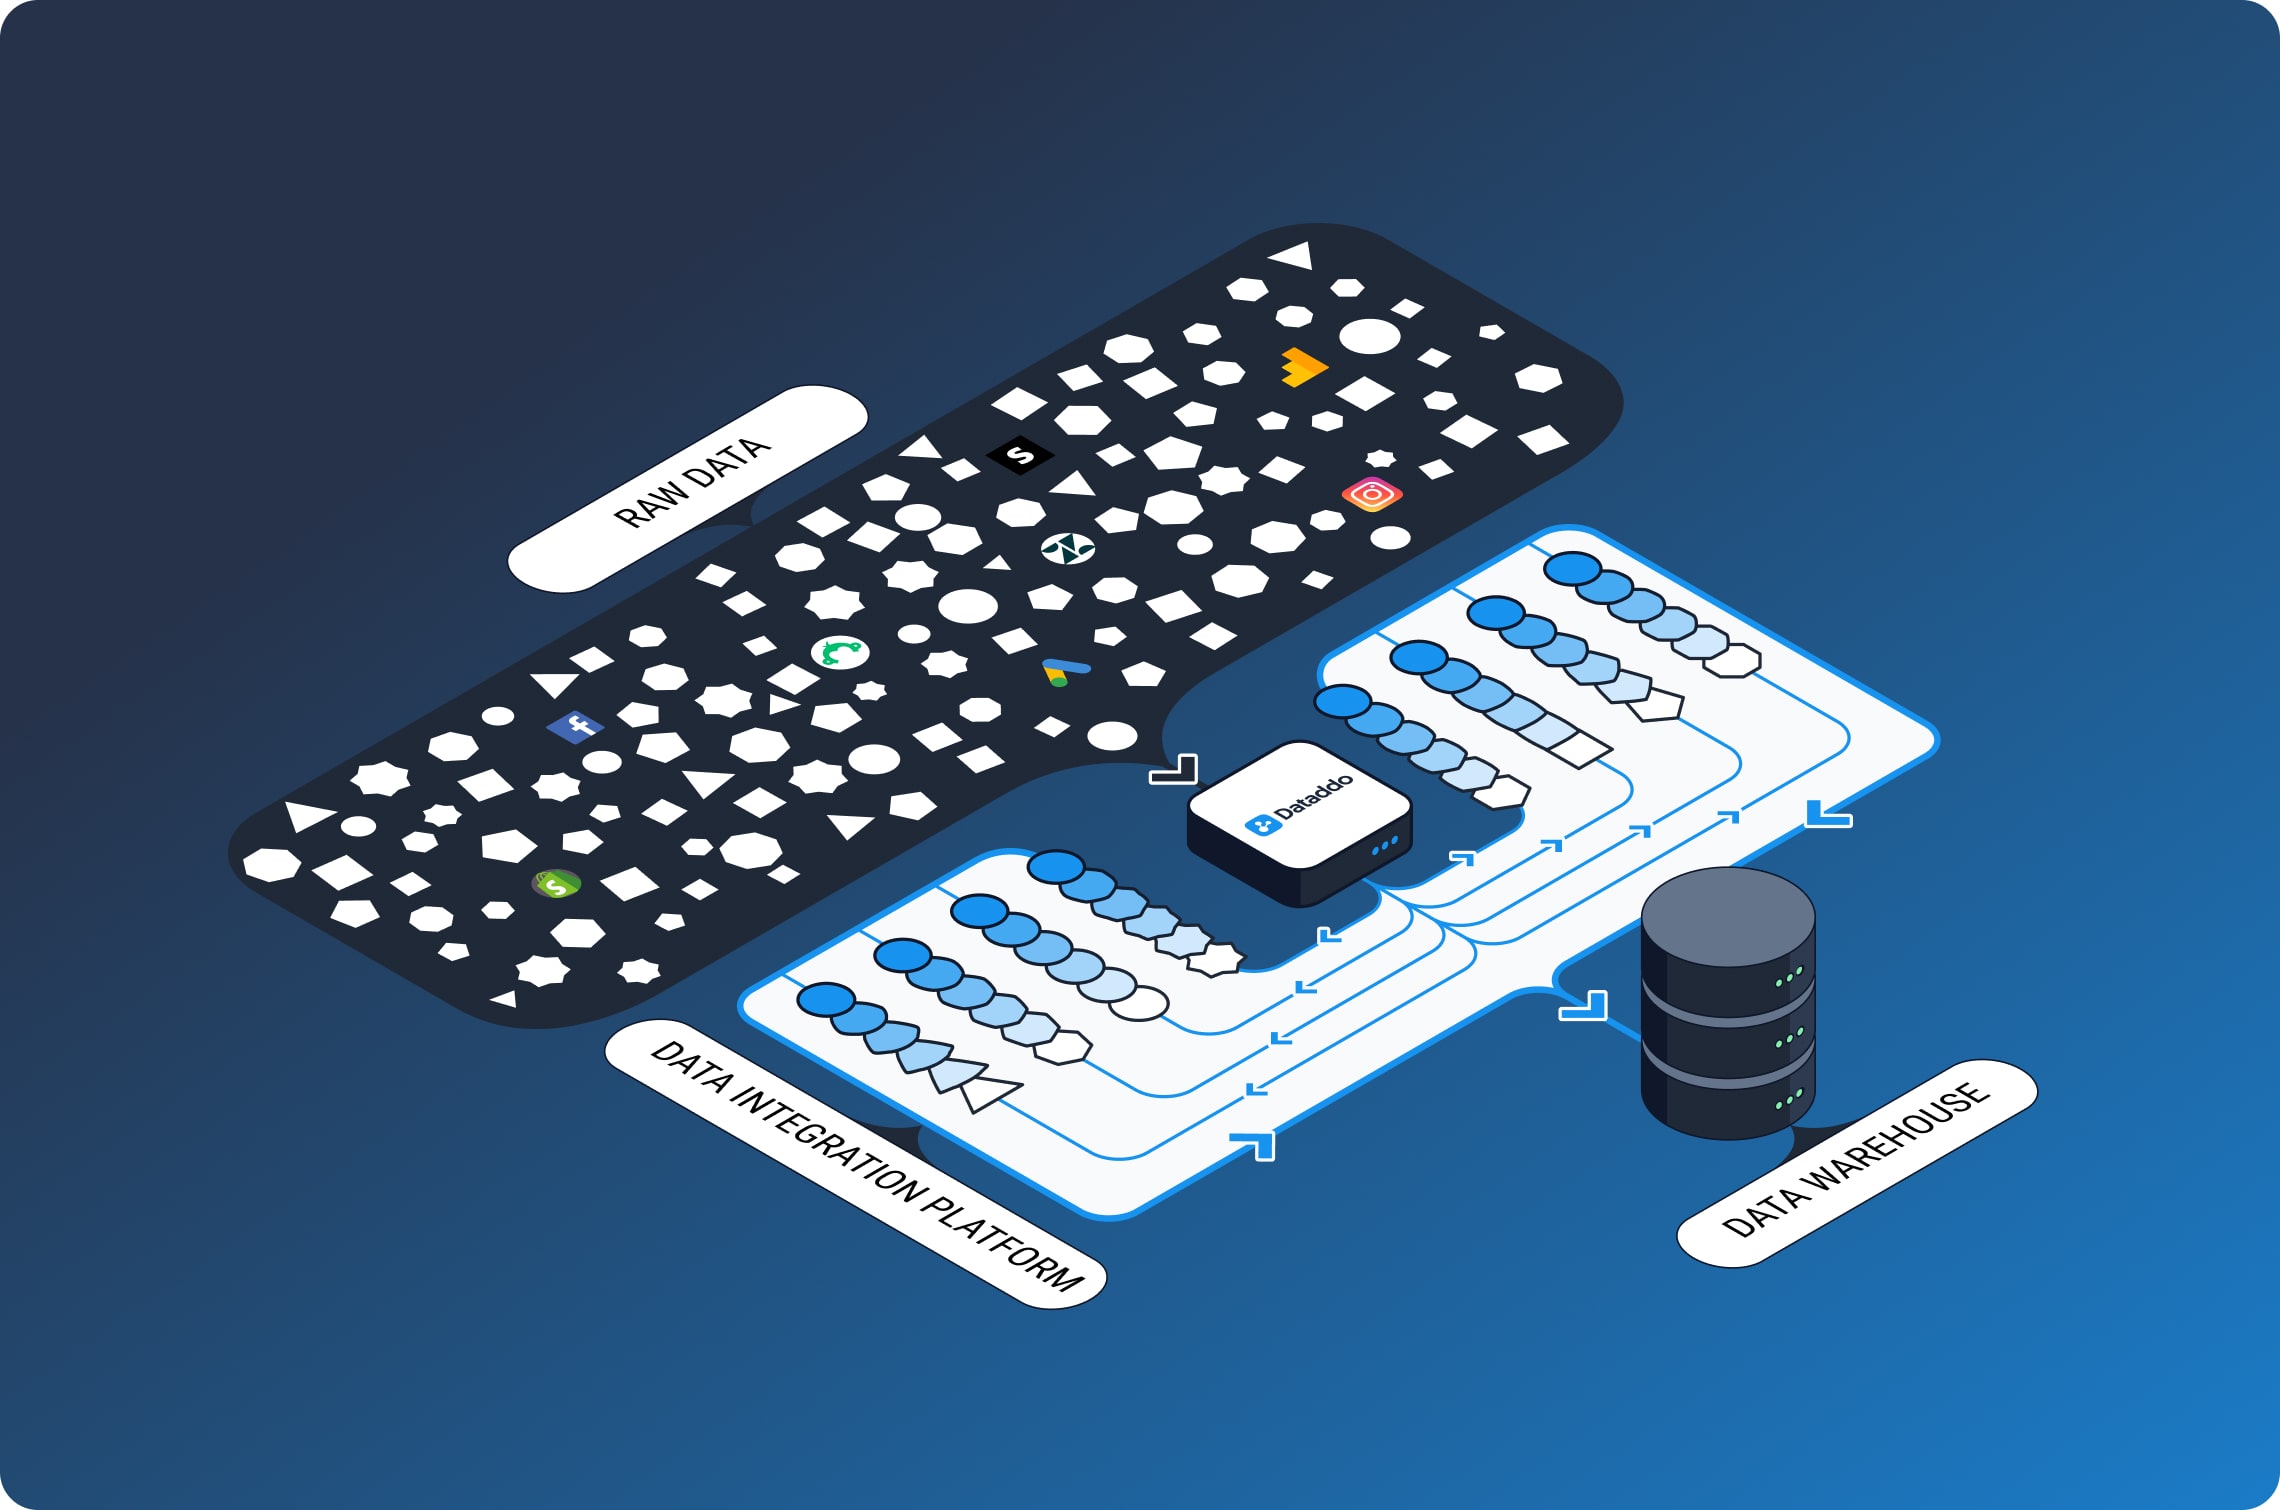
To simplify the integration process and protect the quality of your data from the start, we recommend a data integration platform to do the heavy lifting. Always choose a platform that is cloud-based for better extensibility, lets you manage your data pipelines centrally, and provides the flexibility to add or change connectors as needed. Dataddo is one such platform that achieves this, but you can also feel free to browse other top ETL tools (Extract, Transform, Load) to find the one that best suits you.
5. Transformations
Data transformation is the main point that makes data warehouses worth their investment. Warehouses store data in a particular way that makes it simple to query for the analyses you need. Performing the right transformations makes it possible to retrieve the data and the details you’re looking for.

One example of data transformations is harmonizing, making sure data from disparate sources is in the same format making it easier to be queried in a data warehouse.
Some common transformation scenarios:
- Minimizing duplicates: duplications are very common with eCommerce data, as many records are re-entered during the customer’s shopping and check-out process. Identifying and removing them ensures that your warehouse data reflects reality.
- Harmonizing: data from different sources is usually in very different formats. Converting these data into the same type makes it possible to store and query them in the same table.
- Data cleaning: Removing/recoding missing data and outliers helps protect the quality of your data, leading to more accurate insights.
- Grouping similar data types: You’ll likely want to associate certain data types or data from particular sources, and transformations make this possible.
Transformations can be performed in multiple places—within your data warehouse, or via your integration tool before the data even gets there. Especially with an eCommerce use case, where you could be managing data from multiple stores or at least several applications, transformations are your friend.
6. Building your dashboards
Every business will have vastly different visualizations when they start the reporting process.
Matěj Rešl of DataBrothers has a few suggestions to keep in mind:
- Know your audience. Are you an analyst, creating dashboards for yourself and a management team? Are you the management, learning the basics for simple reporting? Focus on creating reports that suit the audience’s expectations.
- Know your desired output. You can create a dashboard with three numbers, a complicated, in-depth analytical tool, or anything in between. Present information in a way that’s both accessible and useful.
- Learn how to structure a report page. Your report should guide the reader visually, not be something to decipher. Learning basic UX principles and using report components properly (e.g. headers, slicers, axes, etc.) will help you design better reports overall.
- Choose proper visuals. Just because something looks great, like a pie chart or a 3D graph, doesn’t mean it tells the best story. Plus, it’s easy to overdo it, using the same element 2 or 3 times in one report. Experiment to choose visual elements that are appropriate for the type of data you want to relay.
Finally, Steve Fenn of Action Analytics iterates that as you develop your own system for reporting, try to focus on data storytelling—how the structure of your report as a whole provides your audience with the exact answers to their questions and ultimately helps them make better decisions. For your best chances at clarity in this area, try to orient each report/dashboard around a single data source (except in those instances where you must directly compare metrics from multiple sources). Keep your chart choices simple for easier interpretation, and utilize color and arrangement to guide the reader through the dashboard, left-to-right, and up-to-down.
Creating an eCommerce Infrastructure that Lasts
It’s inevitable that as your online business grows and changes, so will the elements of your data architecture. Ensuring that the pieces of your architecture integrate easily is vital to the long-term health and effectiveness of your e-shop. A tool like Dataddo can give you the reliable framework you need to keep your eCommerce data organized and available at every step of the process.
|
See how Dataddo can help your business Just a few quick steps to get your data to your warehouse or dashboard for better analysis, without the hassle.
|


Comments