
Is your business just getting off its feet? Are you a business-owning veteran, but still looking for ways to optimize your social media presence? This article will explain, with detailed steps and templates, how to find and understand your audience, establish goals, and analyze your social data - all steps to creating a solid and data-driven social media strategy that will serve you long-term.
Tip: We’ve included free templates for you to use throughout this article. Download, copy, and use them however works best for you! Download each one individually as you go through the article or scroll to the end to get all of the templates at once.
Why do I need a social media strategy?
Social media is a crucial channel for businesses to connect with and convert customers, whether you primarily rely on foot traffic, e-commerce, or both. Improving your social media strategy with data analytics can increase customer engagement and retention, qualify leads, and increase conversions. Basically: data is more reliable than your gut.
| Table of Contents: Step 1: Find your Audience Step 2: Establish your Goals & Set KPIs Step 3: Form your Content Strategy Step 4: Analyze your Data Step 5: Monitor & Optimize your Campaigns |
Step 1: Find your Audience
Social media success is all about delivering your content to the right people, at the right time, and in the right place. In order to make those factors line up, you must narrow your focus while expanding your reach - using demographic indicators.
You can retrieve your audience’s demographic information on platforms like Google Analytics, Facebook/Facebook Ads, or LinkedIn/LinkedIn Ads. This information can be collected manually or automatically.
While we always recommend the use of an ETL tool to automate certain processes, gathering demographic info typically only needs to be done once (with periodic updates). Using your existing sources, manually research your current audience demographics to create customer personas for your social media strategy.
Specific information to look for:
- Background: job title, career path, family, etc
- Demographic: age, gender, location
- Interests: what do they like on social media?
- Social platforms: where is your audience spending the most time?
For Business-to-Business social media strategy:
- Size of company: SMEs or enterprises
- Decision-makers: who is going to be pulling the trigger on buying your product/service?
- Job function: what area of a company requires your product/service?
- Job seniority: are the entry-level grunts doing the research or does it go straight to the top?
Goals & challenges (aka, Why are they here?): This one is more nuanced, and you’re unlikely to find it on a typical ad platform. Nonetheless, understanding your customers’ motivations is a critical part of marketing to them online. Conducting customer interviews can help answer these questions (and many more questions for your business).
Once you’ve collected your info, either manually entered into a sheet or loaded to a dashboard, you can start creating your personas.
These personas will inform the type of content to post and which channels to post it on. It will also help you nail your unique selling points and the value you bring to your customers.
Audience Research Template
Use this audience research template to compile your demographic information and build personas.
Step 2: Establish your Goals & Set KPIs
Your Goals
Among the many goal-setting frameworks already established, we prefer SMART goals. The SMART framework builds on your initial goal and pushes you to get more specific and clear. SMART is:
- Specific: have a clear direction.
- Measurable: attach a numerical value to your goal to hold you accountable and track your progress.
- Attainable: stay realistic.
- Relevant: ask yourself, “why this goal?” and ensure it’s relevant to overall company goals.
- Timely: give yourself a deadline.
To start off, set between one and five goals. These goals should hold you accountable, guide your budget, and will make you pay attention to your data instead of using guesswork. You may decide to start by focusing on one smaller goal and work up - this is a fine tactic, but only if it can be tracked by data.
Some common initial goals for social media marketing (with examples):
- Increase brand awareness: Increase brand awareness by starting paid advertising campaigns on LinkedIn. Have new content reach more than 5,000 people per post by the end of the month.
- Generate leads and sales: Increase leads from LinkedIn by 8% in the next three months by reaching 8,000 people per paid promotional post.
- Boost community engagement: Boost community engagement on Instagram by asking followers to comment and tag a friend to be entered into a raffle. We will increase engagement by 15% per post.
- Grow your brand’s audience: Increase the number of Instagram followers by 500 in the next month by using relevant hashtags and creating valuable content.
- Drive traffic to your site: Increase website traffic to 1,500 visitors per day by posting and promoting relevant content two times per week on Facebook and LinkedIn.
Remember: these are the starting points. Once you get going, refine and revisit until your SMART goals are perfectly attuned to your business goals.
SMART Goals Template
This simple template will guide you through creating your SMART Goals.
Is SMART not your style? Delve into some other common frameworks:
- OKRs: setting objectives that are qualitative, time-bound, and actionable; and setting 3-5 key results that quantify each objective based on things that are measurable
- BSQ: think big, act small, move quick
- CLEAR: collaborative, limited, emotional, appreciable, refinable
KPIs & Metrics to Track
In your SMART goal document, write down what KPIs (Key Performance Indicators) and metrics you’ll be looking at for each goal and where you can find those metrics (ie Google Analytics, LinkedIn, etc). This will help ensure your goals are measurable and will let you track your progress.
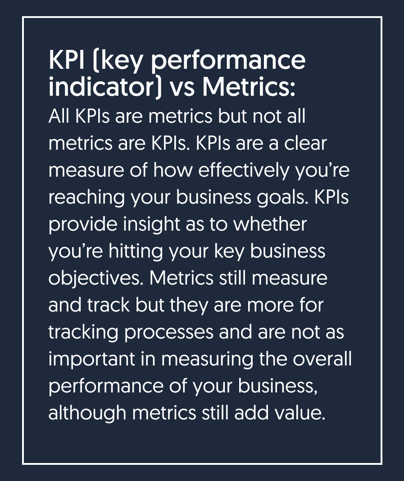
Keep in mind that there is more to social media than likes and comments — While they are helpful, they can be considered “vanity metrics”: they look good, but don’t actually contribute to your goals.
KPIs to track:
- Reach: follower count, impressions, web traffic, share of voice
- Engagement: clicks, likes, shares, comments, mentions
- Conversions (to customer, but also to leads): sales revenue, lead conversion rate, non-revenue conversions
- Customer loyalty: cost per lead, customer lifetime value
Some examples of metrics to track:
|
Increase Brand Awareness |
Generate Leads & Sales |
Boost Community Engagement |
Grow Your Brand’s Audience |
Drive Traffic to Your Site |
|
Follower Counts |
Conversion Rates |
Likes |
Engagement Rates |
Link Clicks |
|
Impressions |
Cost per Lead |
Shares |
Mentions |
Conversions |
|
Reach |
Email Sign-ups |
Comments |
Follower Counts |
Sign-ups |
|
Mentions |
Sales Revenue |
Mentions |
||
|
Link Click |
Clicks |
Some tools to find these metrics: Mediatoolkit, Brandwatch, SEMrush, Google Analytics, social media platforms, Socialbakers (now Emplifi), and any other social listening tool.
Step 3: Form your Content Strategy
While “content strategy” typically refers to all of a company’s marketing content (not just social media), we’re going to focus on social content specifically to help you figure out the direction your social media content should take.
Competitor Research
You probably know who your competitors are, but how well do you know their social media presence? Understanding what you’re up against is vital to finding your marketing niche — research your 4-6 biggest competitors on their most active platforms to see what they’re posting, what’s working, what’s not working, and get ideas for the content gap that your business can fill.
Tip: get inspiration from your competitors, but don’t copy them. Uniqueness is your goal. You can use your competitors as performance benchmarks—number of followers, engagement rates, etc.
To do this manually, make a note of:
- Platforms where they have accounts and platforms where they are active
- The kind of content they are posting (videos, text posts, blog links, etc)
- Engagement on their posts
- The tone of the captions. Are they casual and fun? Do they use emojis? Or are they straight to the point?
- Frequency of posts
- Use of hashtags, how often/how many, and what hashtags

Competitor Research Template
Use this competitor research template to easily compile all of your findings.
Alternatively, social listening tools like Socialbakers, Brandwatch, or Semrush can speed up your competitor research process and give you great insights into your competition.
Hashtag Research
Start finding hashtags by using known industry keywords, or by researching your competitors’ hashtags. (The above social listening tools can also find relevant and popular hashtags for your posts.)
Hashtag Research Template
Use this hashtag research template to keep track of your hashtag finding.
Once you have a list of hashtags, then go to your chosen social platform and search to find their popularity - how many people follow the hashtags, or how many posts include the hashtag. You can also see what kind of content is being posted for that specific hashtag to ensure the hashtag is actually relevant to your business.
Social Media Audit
Before moving forward with your social media strategy, you need to take a hard look at your current social media presence to understand what has worked in the past and what can be improved upon moving forward.
Conduct an audit of each platform your company has an account on, including platforms where you may not have posted in a while. For each platform, document existing profile info like your description/bio/about section. Identify the frequency of past posts and the weekly average and track your follower count over time. Then decide on which KPIs you’d like to focus on for each platform, keeping your SMART goals in mind.
Social Media Audit Template
Use this social media audit template to keep track of your own social media presence, platform-by-platform.
While conducting your audit, keep in mind the best practices for each platform and see if you’ve been abiding by them. For example, do you use 30 hashtags on a Facebook post? That might be ok on Instagram but may be a bit much for Facebook.
Taking this all together, you can find what needs to be updated and take steps to improve your KPIs.
Tip: Instagram insights doesn’t let you track follower count over time, but a data integration service like Dataddo can help you find this information. Read our article on How to Track your Instagram Follower Count.
Content Calendar
Finally, you need a way to plan and organize your posts (we recommend a trusty calendar). You can track when to post what, including the copy and any graphics or links that may be included.
Content Calendar Template
Use this social media content calendar to keep track of what to post and when.
In deciding what kind of content to post, reference your previous research on competitors, hashtags, and your own social media audit to find what works best. Keep your audience in mind to post content that will provide value for your followers.
Also, keep in mind the best practices for each platform. Certain kinds of content may work great on one platform but won’t do very well on another. Mix up what you’re posting across channels so your followers will find different valuable content on each platform.
Once you’ve figured out the types of content that work well across channels, find your best performing posts to re-share in the future, while making sure the post is still relevant and can provide value. But, remember that republishing content works differently on different platforms. For example, generally, you can repost the same content on Twitter more than on Facebook and more on Facebook than on Instagram.
Timing

Checking Facebook and Instagram Insights will show you higher activity times to post for your audience. But, choosing a posting time isn’t always black and white—when you post when your fans are most active, there’s a higher chance of them seeing your post and engaging. Or, posting when your fans are least active means less competition for the spaces in the newsfeed. Timing your posts is ultimately trial and error. You may even find that the time of day you post doesn’t actually matter at all for post success!
Content Mix
Regarding content variety, there’s one golden rule: you don’t want all of your posts to be self-serving. Beyond that, various content mix strategies include:
- 4:1:1 - four pieces of new content, one repost, and one self-serving/sales post
- 80/20 - 80% of content should be education/valuable/entertaining to your audience, 20% can be explicitly to promote your business
- Rule of thirds - ⅓ of posts used to promote your business, ⅓ to share ideas of thought leaders in your industry, and ⅓ to personally interact with your audience.
Curate Content
Your content calendar can also be used for content ideas or to keep track of external links to use in future content—becoming a thought leader in your industry means keeping up with the latest trends. Keep tabs on your audience’s favorite news sources (blogs, influencers, newsletters, etc) and share links that would be valuable to your audience. This can also fill gaps in your content calendar.
Step 4: Analyze your Data
You’ve been working with data this whole time, but actually analyzing it is another game entirely (and the most important step in this article). To ensure you’re gathering all the necessary data from your different data sources, we always recommend using an ETL platform, like Dataddo. Dataddo automates the process of moving data from disparate data sources into a dashboard, warehouse, or spreadsheet, so you can spend your valuable time actually analyzing it.
Share Score: Organic Posts
While there are several ways to track your organic post performance, our favorite way is to use the Share Score. Share Score, originally developed by the content team at Moz, takes into account different metrics that can be measured with assigned weights, giving you one simple number per post to compare its success against other posts.
The formula, though complicated, works through its highly customized approach. You can choose any metric to work with for each post, and you can even assign different weights to each metric according to their importance for you and your organization.

You can get your Share Scores from the social media platform to Google Sheets using Dataddo - all for free.
To get your Share Scores, you first need to create a source in Dataddo to pull the metrics you want to track from the platform. Then connect that source to a Google Sheet destination.
In a separate sheet in the workbook is where your data will be organized and separated by post and where the Share Score will be calculated.
LinkedIn Share Score
Use this LinkedIn Share Score template to start calculating your share score (if using Dataddo or another integration platform, use these sheets as your data destination).
Instagram Share Score
Use this Instagram Share Score template to start calculating your share score (if using Dataddo or another integration platform, use these sheets as your data destination).
Note: Unfortunately, Facebook’s API doesn’t allow for the extraction of post captions so this wouldn’t work for Facebook posts unless you want to do it manually. Which would be a pain in the butt.
Hashtag Performance
In addition to seeing the performance of each post, you can also use the above templates to find important hashtag information based on your past posts. In the “Share Score” tab, you can track how many hashtags and which hashtags you use in each post. Then in the “Hashtags” tab, you can track the performance of the posts that contain your main hashtags. Our provided templates show the performance of each hashtag broken down by month as well as the average impressions, clicks, and likes for each hashtag. Remember to edit the sheet over time as your goals (and hashtags) change.
Some Other Evaluation Techniques
- Kaushik’s 4 Major Social Media Metrics: conversion rate, amplification rate, applause rate, and economic value
- Sorting Columns: simply sorting columns from highest to lowest for the metric you’re looking at
- Revenue per channel: this requires advanced analytics to be in place to track the progress of the customer journey and then assign revenue per channel
- Category and Call-to-Action Spreadsheet: each post has 14 variables including date, target, comments, likes, category, sub-category, call-to-action, target demographic, etc.
Organic Post Performance
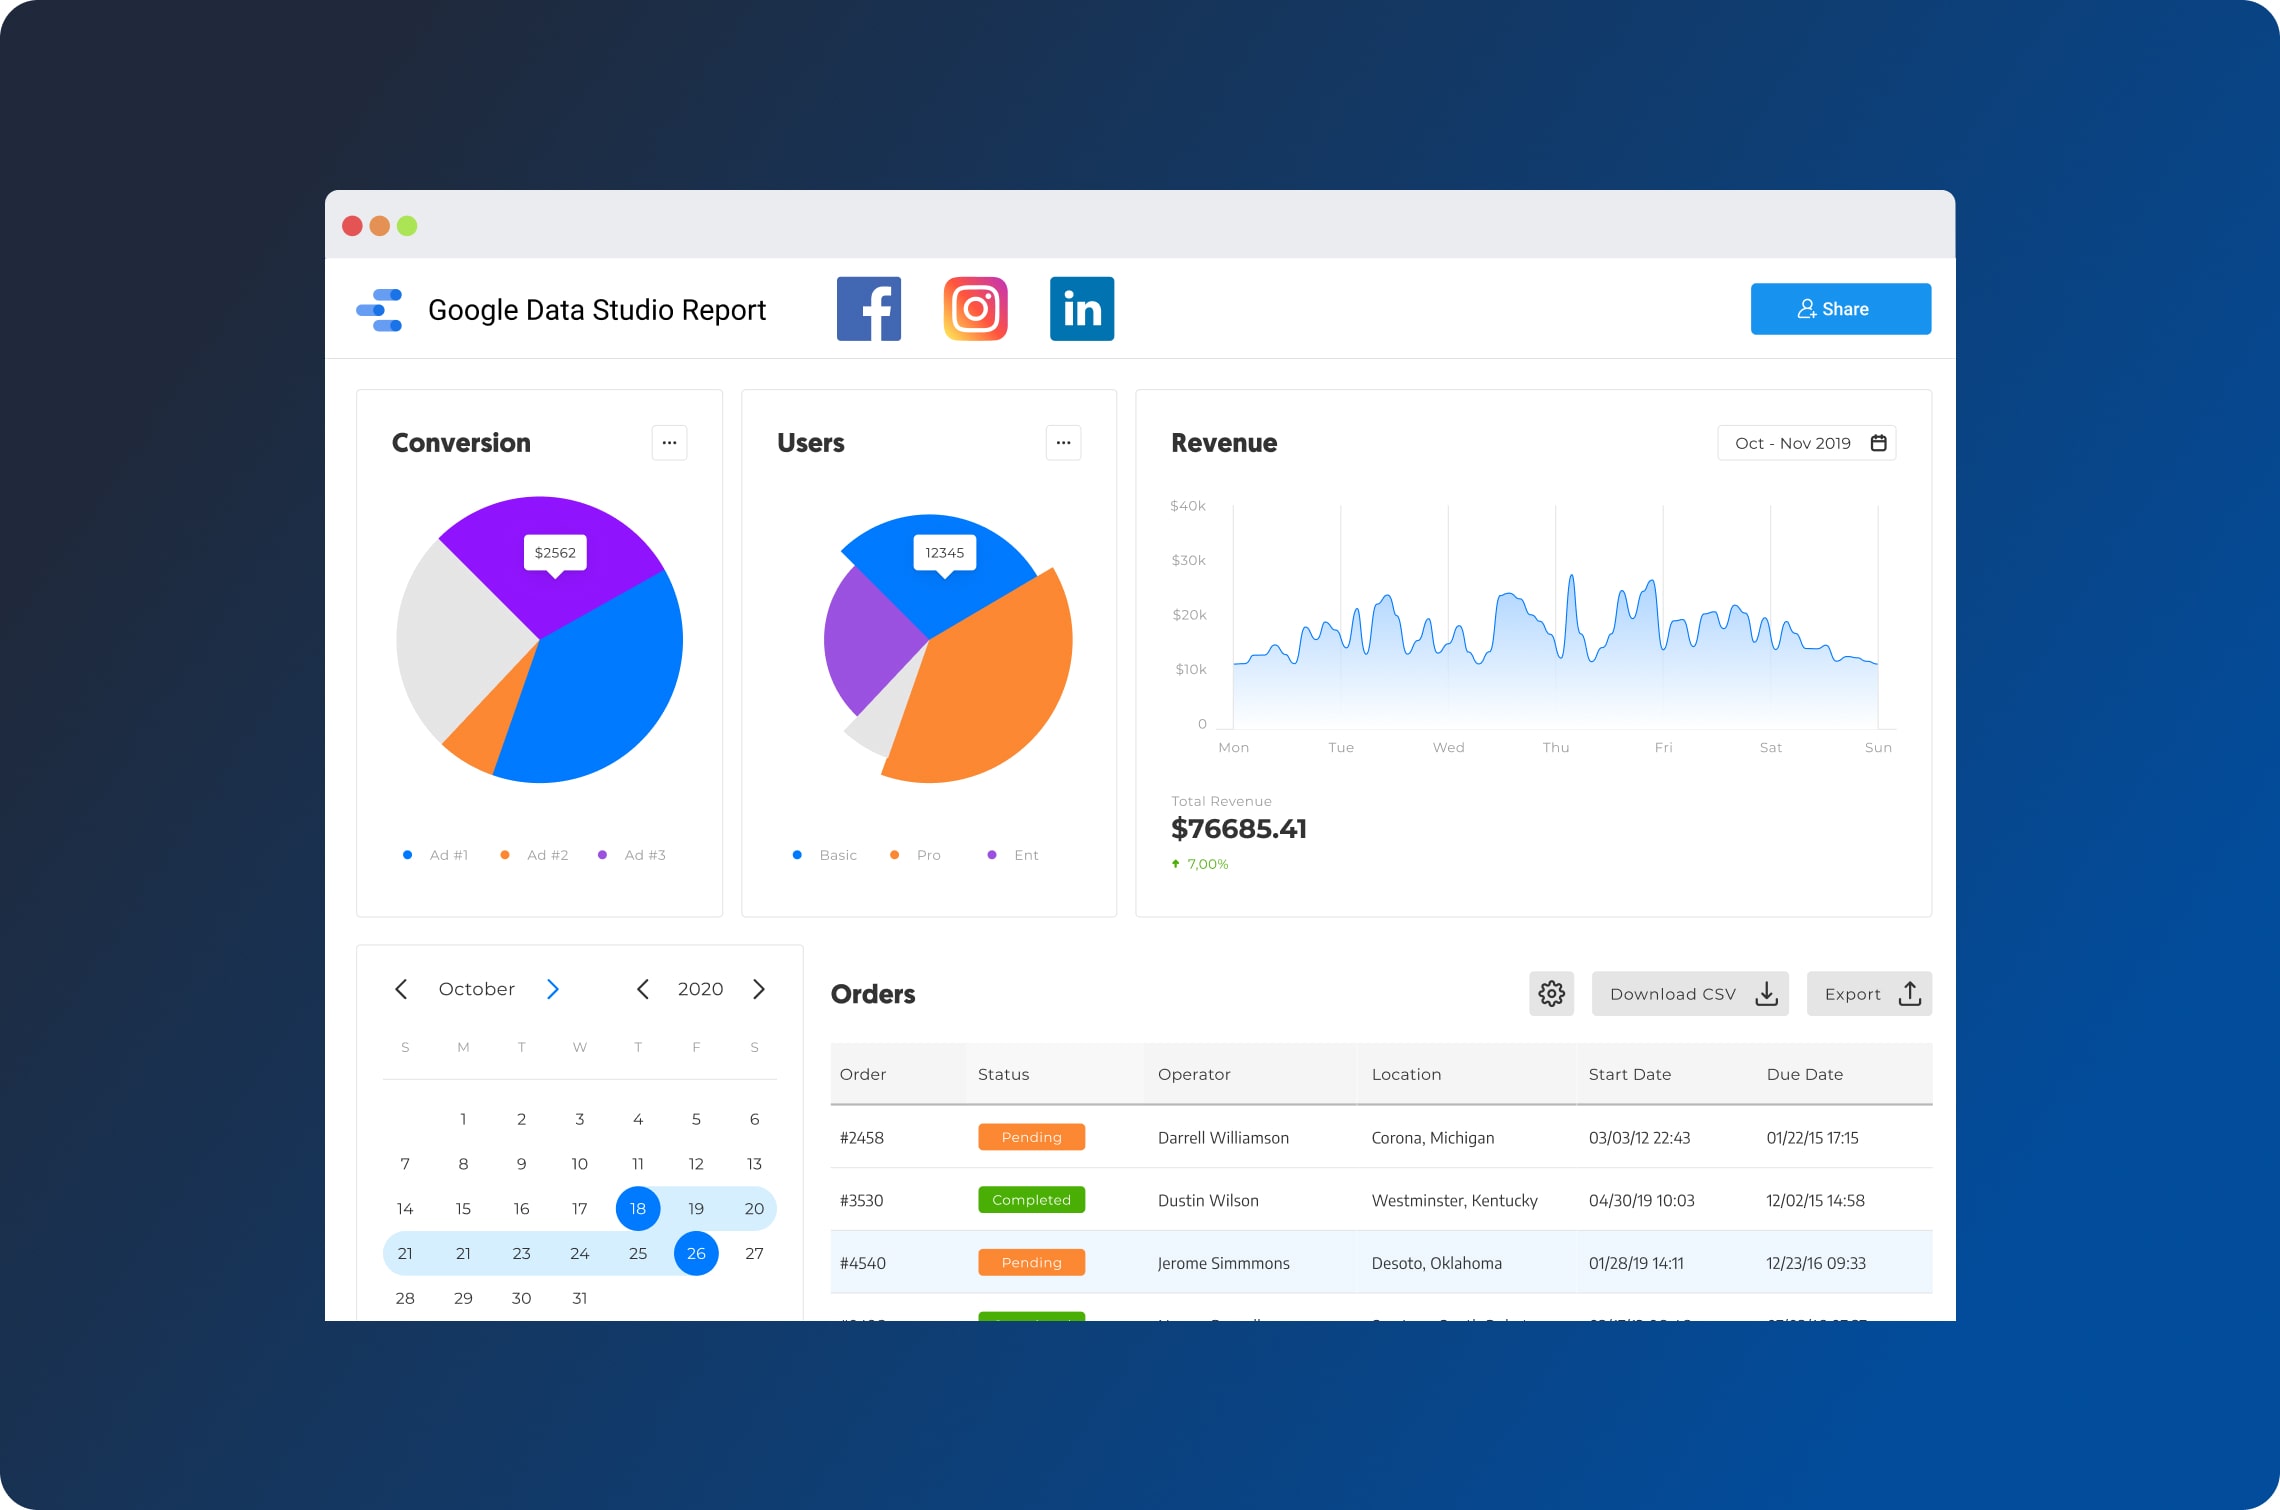
A different, or additional, way of tracking organic post performance is by loading the data into a dashboard to visualize the important metrics you want to keep track of. When visualizing in a dashboard, it’s easier to keep track of metrics over time, such as link clicks, or how many impressions posts received in a certain month.

Organic Post Performance
Use this Google Data Studio Organic Post Performance dashboard to visualize your post performance metrics.
When connecting your data sources to your dashboard (which you can do for free using an integration service like Dataddo), be sure to choose the attributes below for optimum results:
|
Facebook Post |
|
Instagram Media |
|
Likes |
Like Count |
Like Count |
|
Post Impression Organic |
Impression Count |
Impressions |
|
Post Clicks |
Click Count |
Click Count |
|
Post Link Clicks |
Text |
Comments Count |
|
Post Created Date |
Date |
Reach |
|
Caption |
Engagement |
|
|
Caption |
||
|
Timestamp |
Paid Ad Performance
Paid ads on social media oftentimes have completely different metrics to track, more related to cost. In an ads dashboard, you should see performance broken down by campaign as well as spend metrics and conversions, in addition to your usual likes, comments, and impressions that you find with organic posts.

Social Media Paid Ads Dashboard
Use this Google Data Studio Social Media Paid Ads dashboard visualize your paid ads data.
This information is vital in informing your paid ad strategy. It will give you a better idea of what content is performing well and where you should spend your budget to optimize the campaigns and ads that are producing results.
Choose the attributes below when creating your ad sources in Dataddo for the best possible dashboard:
|
Facebook Ads |
LinkedIn Ads |
Instagram Ads |
|
Reporting Level: Ad |
Pivot: Campaign |
Reporting Level: Ad |
|
Conversions |
Company Page Clicks |
Total Clicks |
|
Post Engagement (count) |
External Website Conversions |
Post Engagement |
|
Impressions |
Impressions |
Impressions |
|
Link Clicks (count) |
Landing Page Clicks |
Spend |
|
Spend |
Cost |
Ad Name |
|
Ad Name |
Reporting Date Start |
Ad Set Name |
|
Ad Set Name |
Campaign Name |
Campaign Name |
|
Campaign Name |
Breakdown: Region |
|
|
Reporting Date Start |
||
|
Breakdown: Country |
Create up to 3 flows to any dashboard or Google Sheets ALL FOR FREE using Dataddo.
Sign-up for a free 14-day trial and continue on the FREE FOREVER plan to visualize your data in your dashboards.
A Note About Dashboards
When creating dashboards, think about how you can present them to your stakeholders in a way that will help them understand the importance of the information. One way you can do this is by giving them context; what was going on in the business or social media sphere to better understand why the numbers are how they are?
In addition, consider the granularity of your data. If you’re running reports quarterly, do you only need to get down to monthly numbers, or do your stakeholders want to see daily numbers for the whole quarter? This will be important in formatting and organizing your dashboard to suit your audience.
Some examples of granularity:
- Per day (ie total clicks): this will give you the big picture view of daily activities but does not take into account differences in daily posting frequency.
- Per post (ie average clicks): this can be helpful for a content strategy to see what types of posts are performing well and what’s not.
- Per follower (ie click rate): for follower info, think about rates (divide the metric by the number of followers, or by reach, or impressions); ie if your post has 200 clicks and you have 400 followers, that’s a 50% click rate! But if you have 4,000 followers your click rate is only 5%.
ALL Social Media Strategy Templates from this article
Download all Social Media Strategy Templates and dashboards from this article by filling out the form here.
Step 5: Monitor & Optimize your Campaigns
Never forget that social media is an ever-evolving medium, so your social media strategy cannot be static. Even with all of your new dashboards and sheets up and running, it is vital to monitor and update your documents according to your results, allowing you to make improvements over time. Optimization can mean optimizing individual posts by trying different copy/hashtags/graphics etc, or by changing up your posting schedule to find the right time and cadence of posts that work for your audience.
Data lets you connect with your audience and learn what they engage with so you can work to those strengths. Identify top-performing content based on your KPIs, look for common threads between your most engaged-with posts and your links, and most importantly: don’t be afraid to try something new (as long as you can back up your decision with data).
Always track and reevaluate your progress and your goals, staying open to changing and redefining those goals as necessary. Learn from the experience and move forward with more knowledge as to how to make your social media strategy truly great.
|
See how Dataddo can optimize your marketing pipelines - FOR FREE. Just a few quick steps to get your marketing data to your dashboard or Google Sheets for better analysis, without the hassle and without the cost.
|


Comments