

If you use HubSpot for your CRM, you probably chose it for its versatility and ease of use in Sales, Support, and Marketing arenas. Or….it was free. Either way, the ubiquitous nature of HubSpot means that for those using it, a massive proportion of their internal data is wrapped up in the application, and being able to easily export this data for analysis (specifically, Sales Forecasting) is paramount.
Creating Financial Forecasts: The Old Way
Scenario: a finance manager periodically needs to see the sales forecast for the upcoming months, so she needs to reach out to the sales team for the necessary data from HubSpot. Once she has it, it needs to be manually imported to Power BI to generate the forecasting report—and this process is repeated every time she needs the report.
This approach is not without its problems—the Power BI report is only updated when the finance manager requests it, and with board members checking the company Power BI account whenever they please, the numbers they see are rarely up-to-date. Not to mention, extracting the HubSpot data requires the Sales team to interrupt their usual tasks, distracting them and leading to productivity issues.
The Problem With HubSpot Reports
HubSpot is an excellent tool for managing (and even measuring) your sales, support, or marketing activities. They have reporting capabilities for many metrics, including probability forecasting. However, as a holistic reporting tool, it’s less-than-ideal: CRMs are not built for reporting and financial analysis, and despite the advancements recently made by HubSpot in their forecasting features, report offerings are still limited.
The basic sales reports offered by HubSpot are difficult to read, consisting of clunky collections of your existing deals with total price count. But this report offers nothing in terms of future projections.
One other report option does include win probability for all of your combined deals, which can help with actual forecasting.
However, this format does not provide a month-to-month overview of the deals as well - a crucial element in thorough forecasting.
CRM Data Is Better On a BI Dashboard
Using a separate business intelligence tool like Power BI to report your HubSpot data allows you to automate your financial projections, optimize the reports for your needs, and save valuable time to focus on other tasks.
Automating the movement of your data from HubSpot to Power BI, as well as ensuring that the data is clean enough to work in Power BI, will require a data integration (ETL) platform. Dataddo is one such platform that can extract and load your HubSpot data with ease.
HubSpot to Power BI Using Dataddo: An Overview
Use the Dataddo connector to create the integration between HubSpot and Power BI.
Due to the data being separated in HubSpot’s API, you will use the connector twice to retrieve two necessary datasets from HubSpot: “Deals” and “Pipelines.” This will result in two Data Sources within Dataddo.
Here are the properties you will need to select in Dataddo for each dataset:
For "Deals" pick:
- Amount
- Closedate
- Dealname
- Dealstage
- Id
- Pipeline
For "Pipelines" pick:
- Label
- Pipelineid
- Stageid
- Stagelabel
- Stageprobability
Creating the Source in Dataddo
Keeping the above properties in mind, follow these steps to create your first HubSpot Source:
- In your Dataddo account, go to the Sources tab and click “New Source”
- Select “HubSpot” from the list of connectors
- Connect your HubSpot account using your HubSpot email address
- Click “Next”
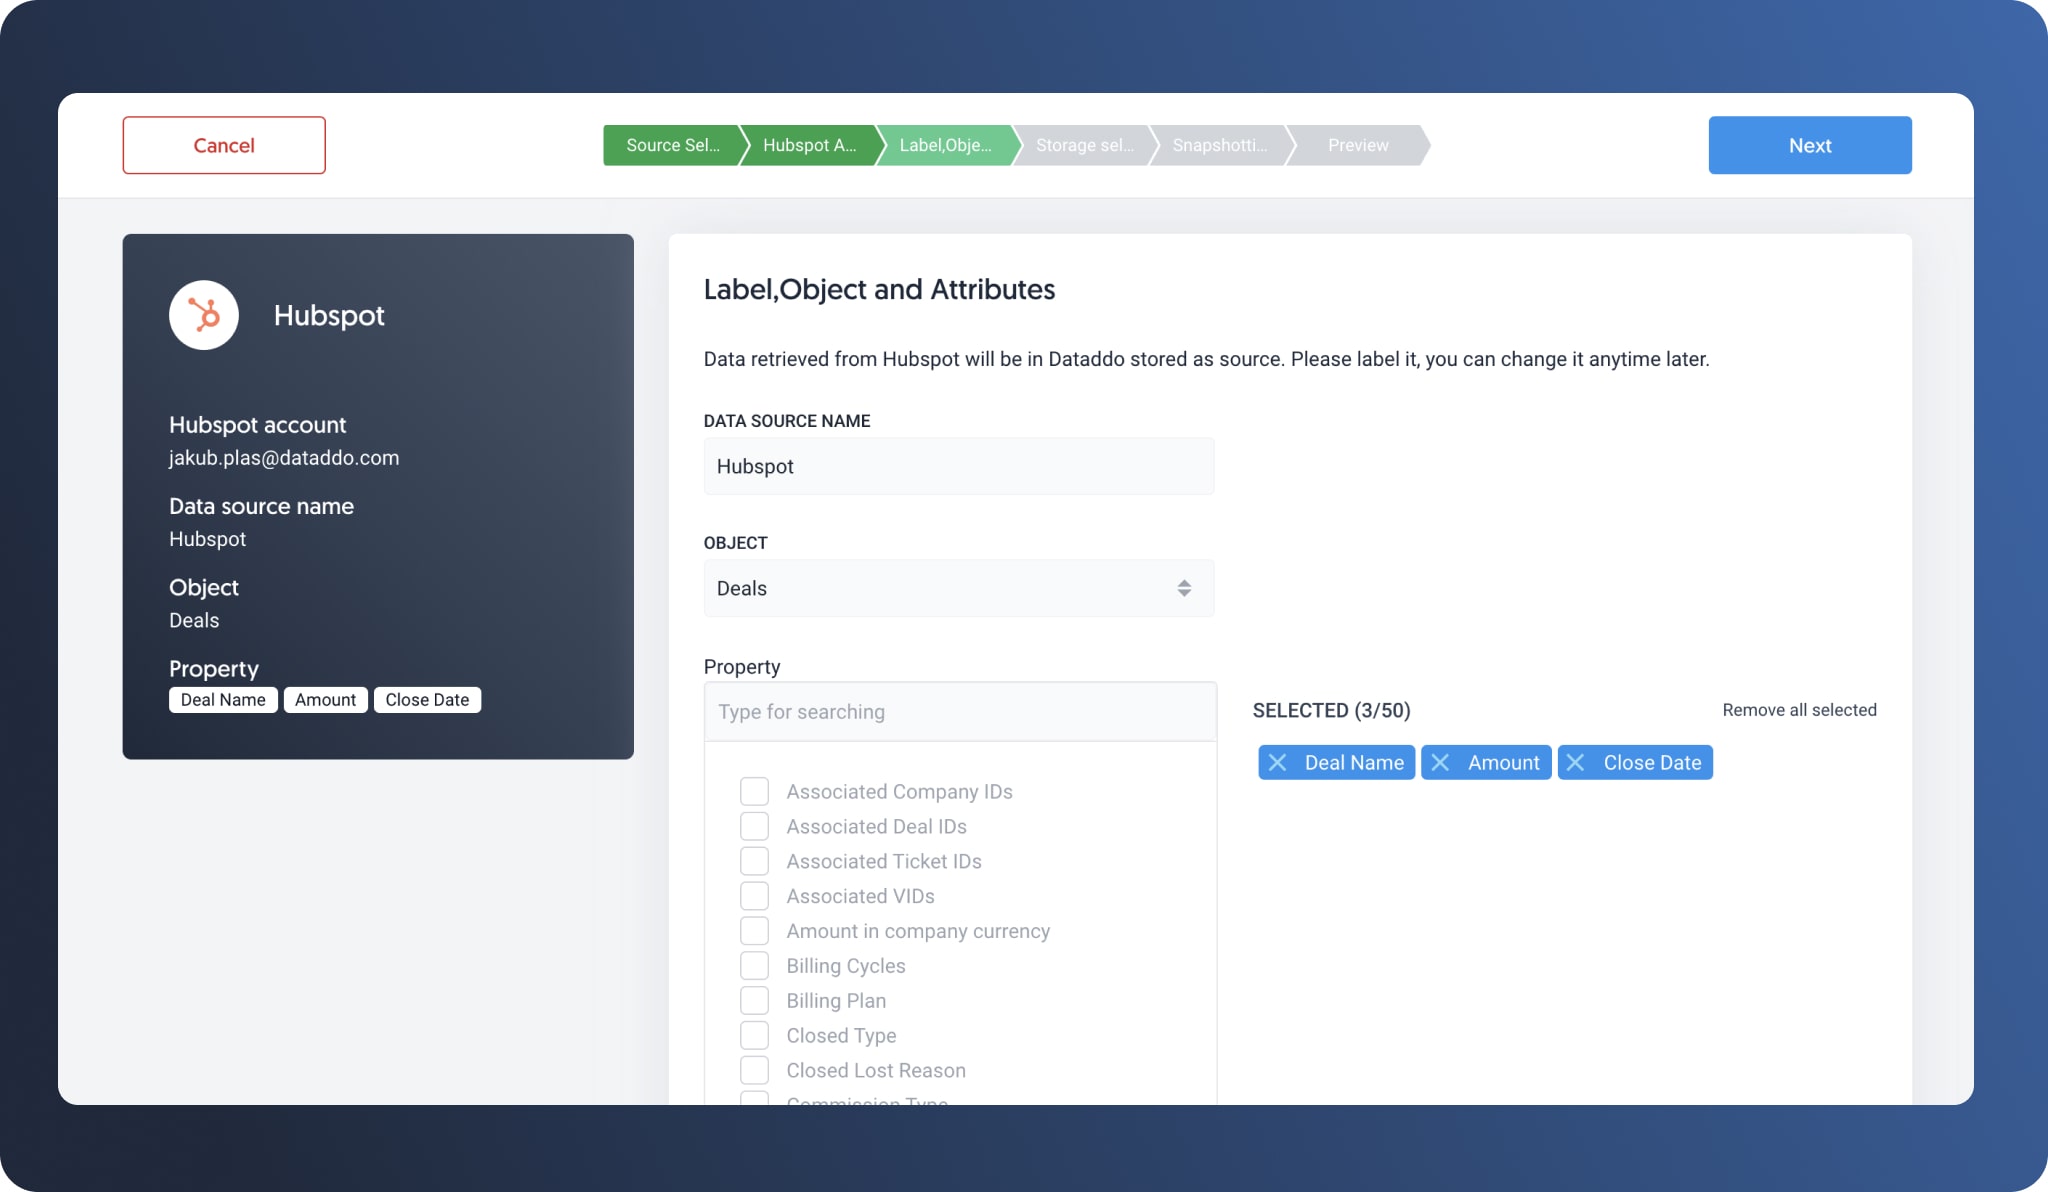
- Name your source and select the object as “Deals”
- Select the properties we listed above for “Deals”
- Click “Next”
- Set your snapshotting preferences: daily frequency, hour, and timezone as you need
- Set retention to REPLACE
- See the preview
- Save the source
Follow the same procedure for “Pipelines” with the properties listed above.
Creating the Data Flow
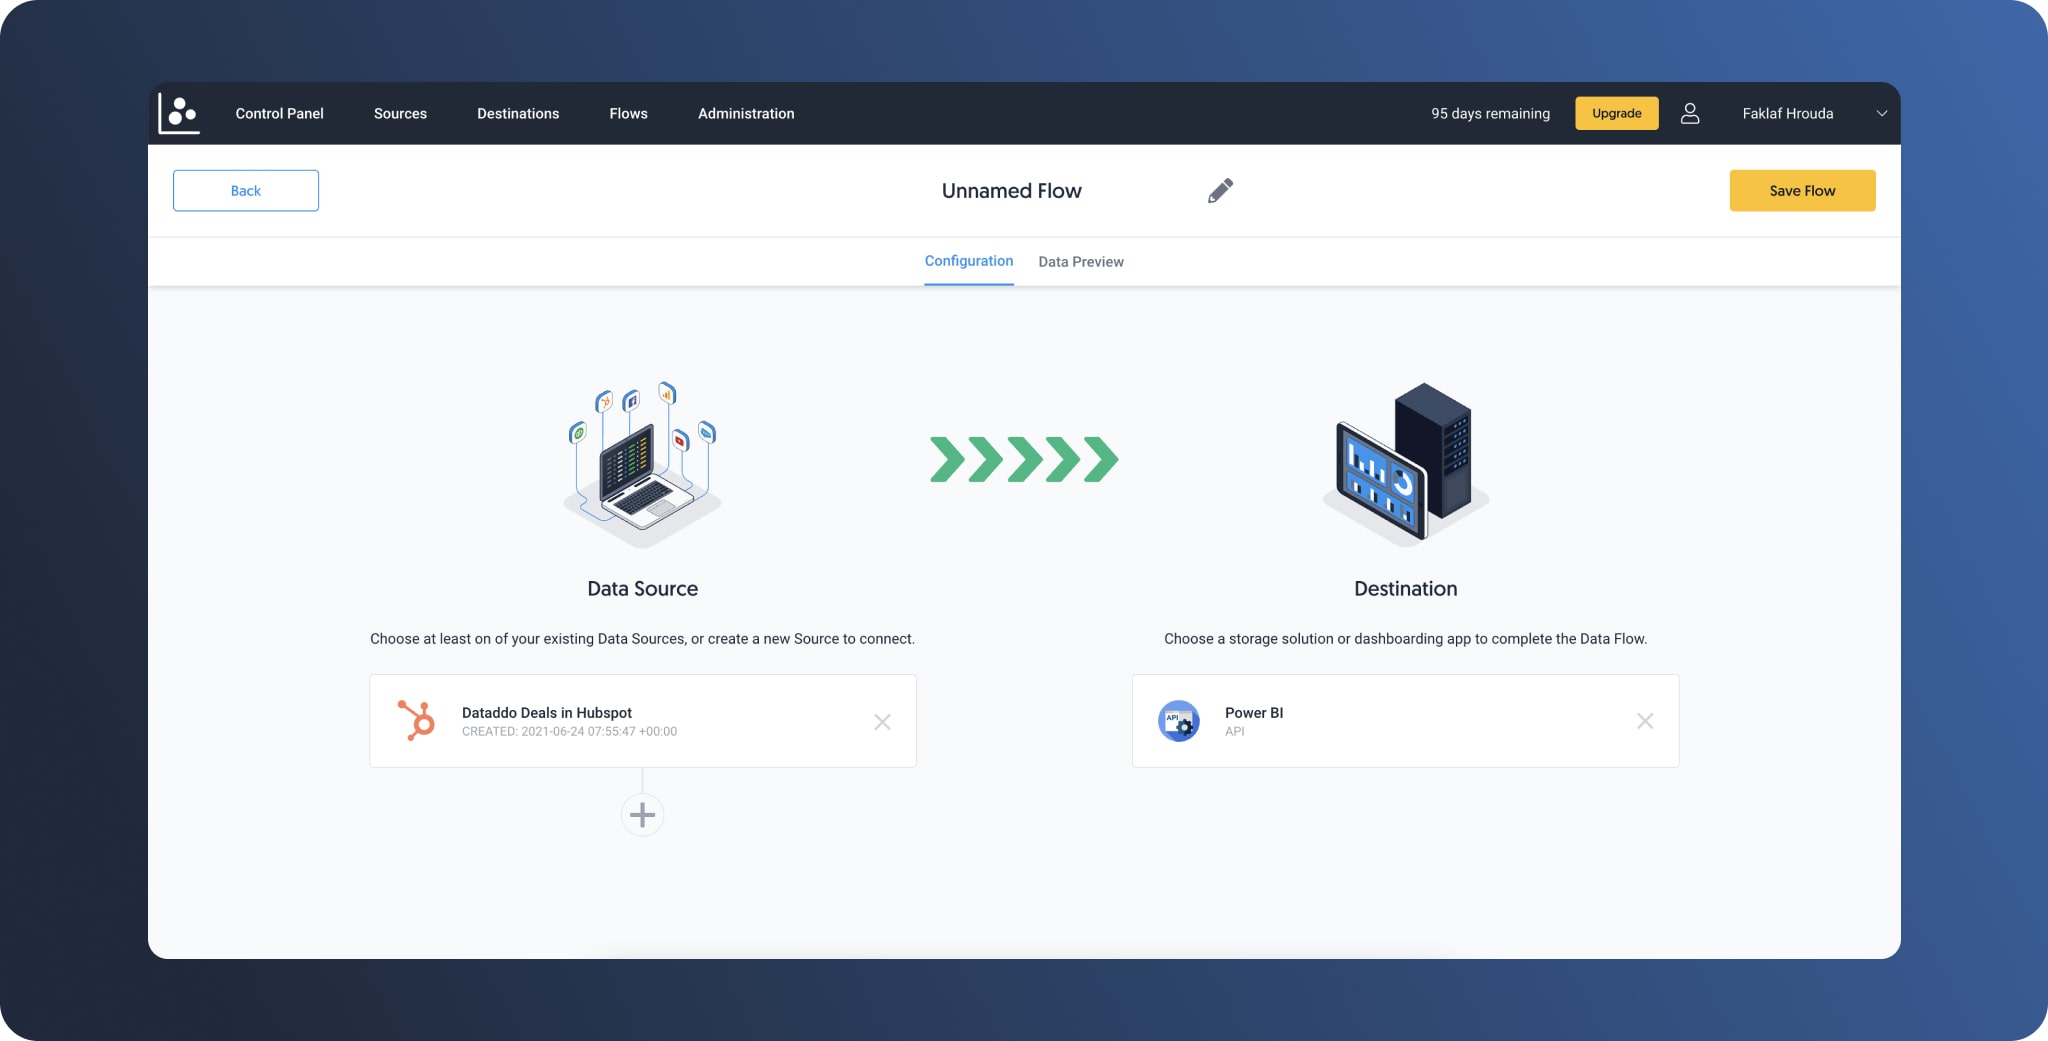
Your Data Flow is the component of Dataddo that sends your data to your destination - in this case, Power BI.
- In your Dataddo account, go to the Flow section and click “New Flow”
- On the left, click “Add Source” and find one of the sources you created
- On the right side select power BI
- Name and save the flow
Repeat the process for your pipeline Source. You can merge/blend both sources in the Dataddo platform and send it to Power BI as one source, but we want to keep both data sources separated and work with them in Power Bi as two independent sources.
For connecting your data with Power BI, you have to use the Power BI desktop app. Unfortunately, it is not possible to connect your data via the web version of the Power BI.
Final Steps in Power BI
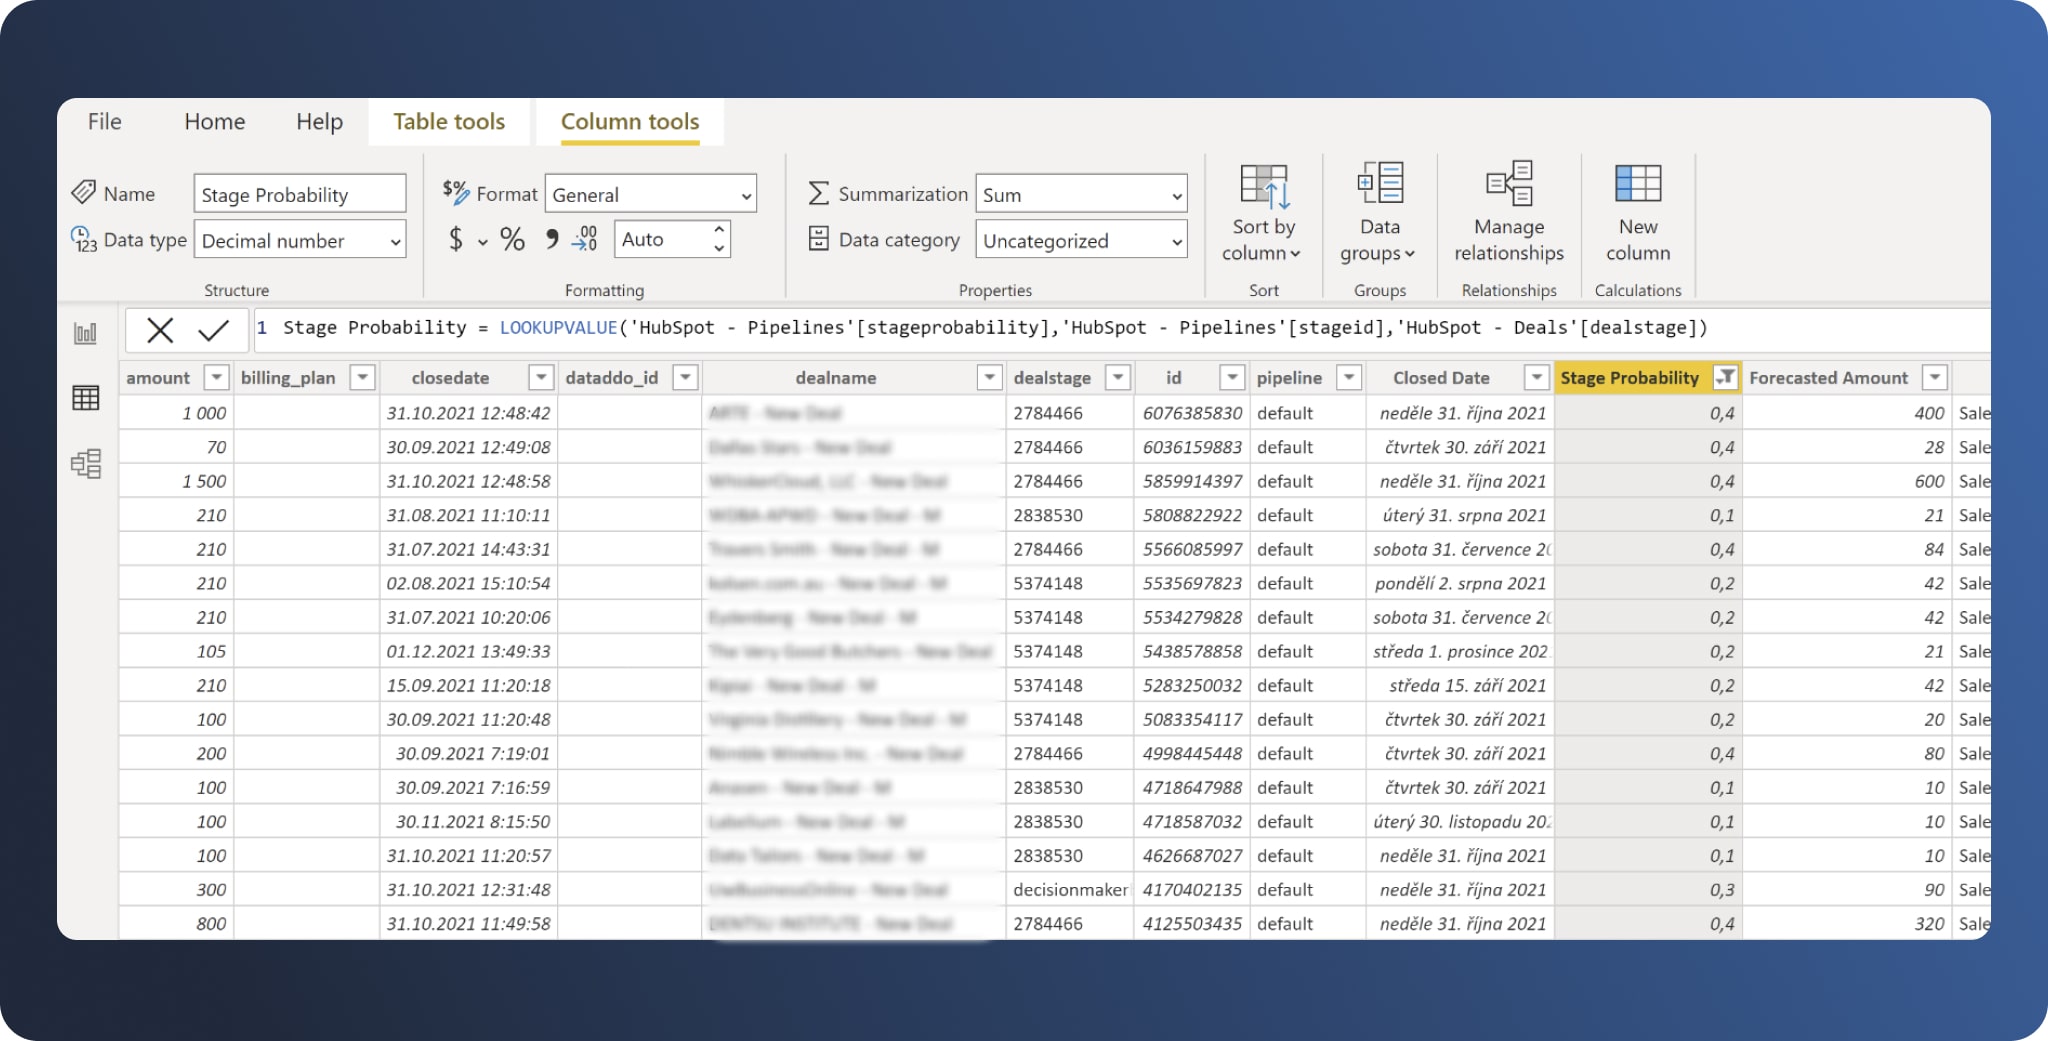
Step 1: After you have followed the above guides to bring your data into Power BI, you must create a relationship between “Pipeline” in your “Deals” table and “Pipelineid” in your “Pipelines table.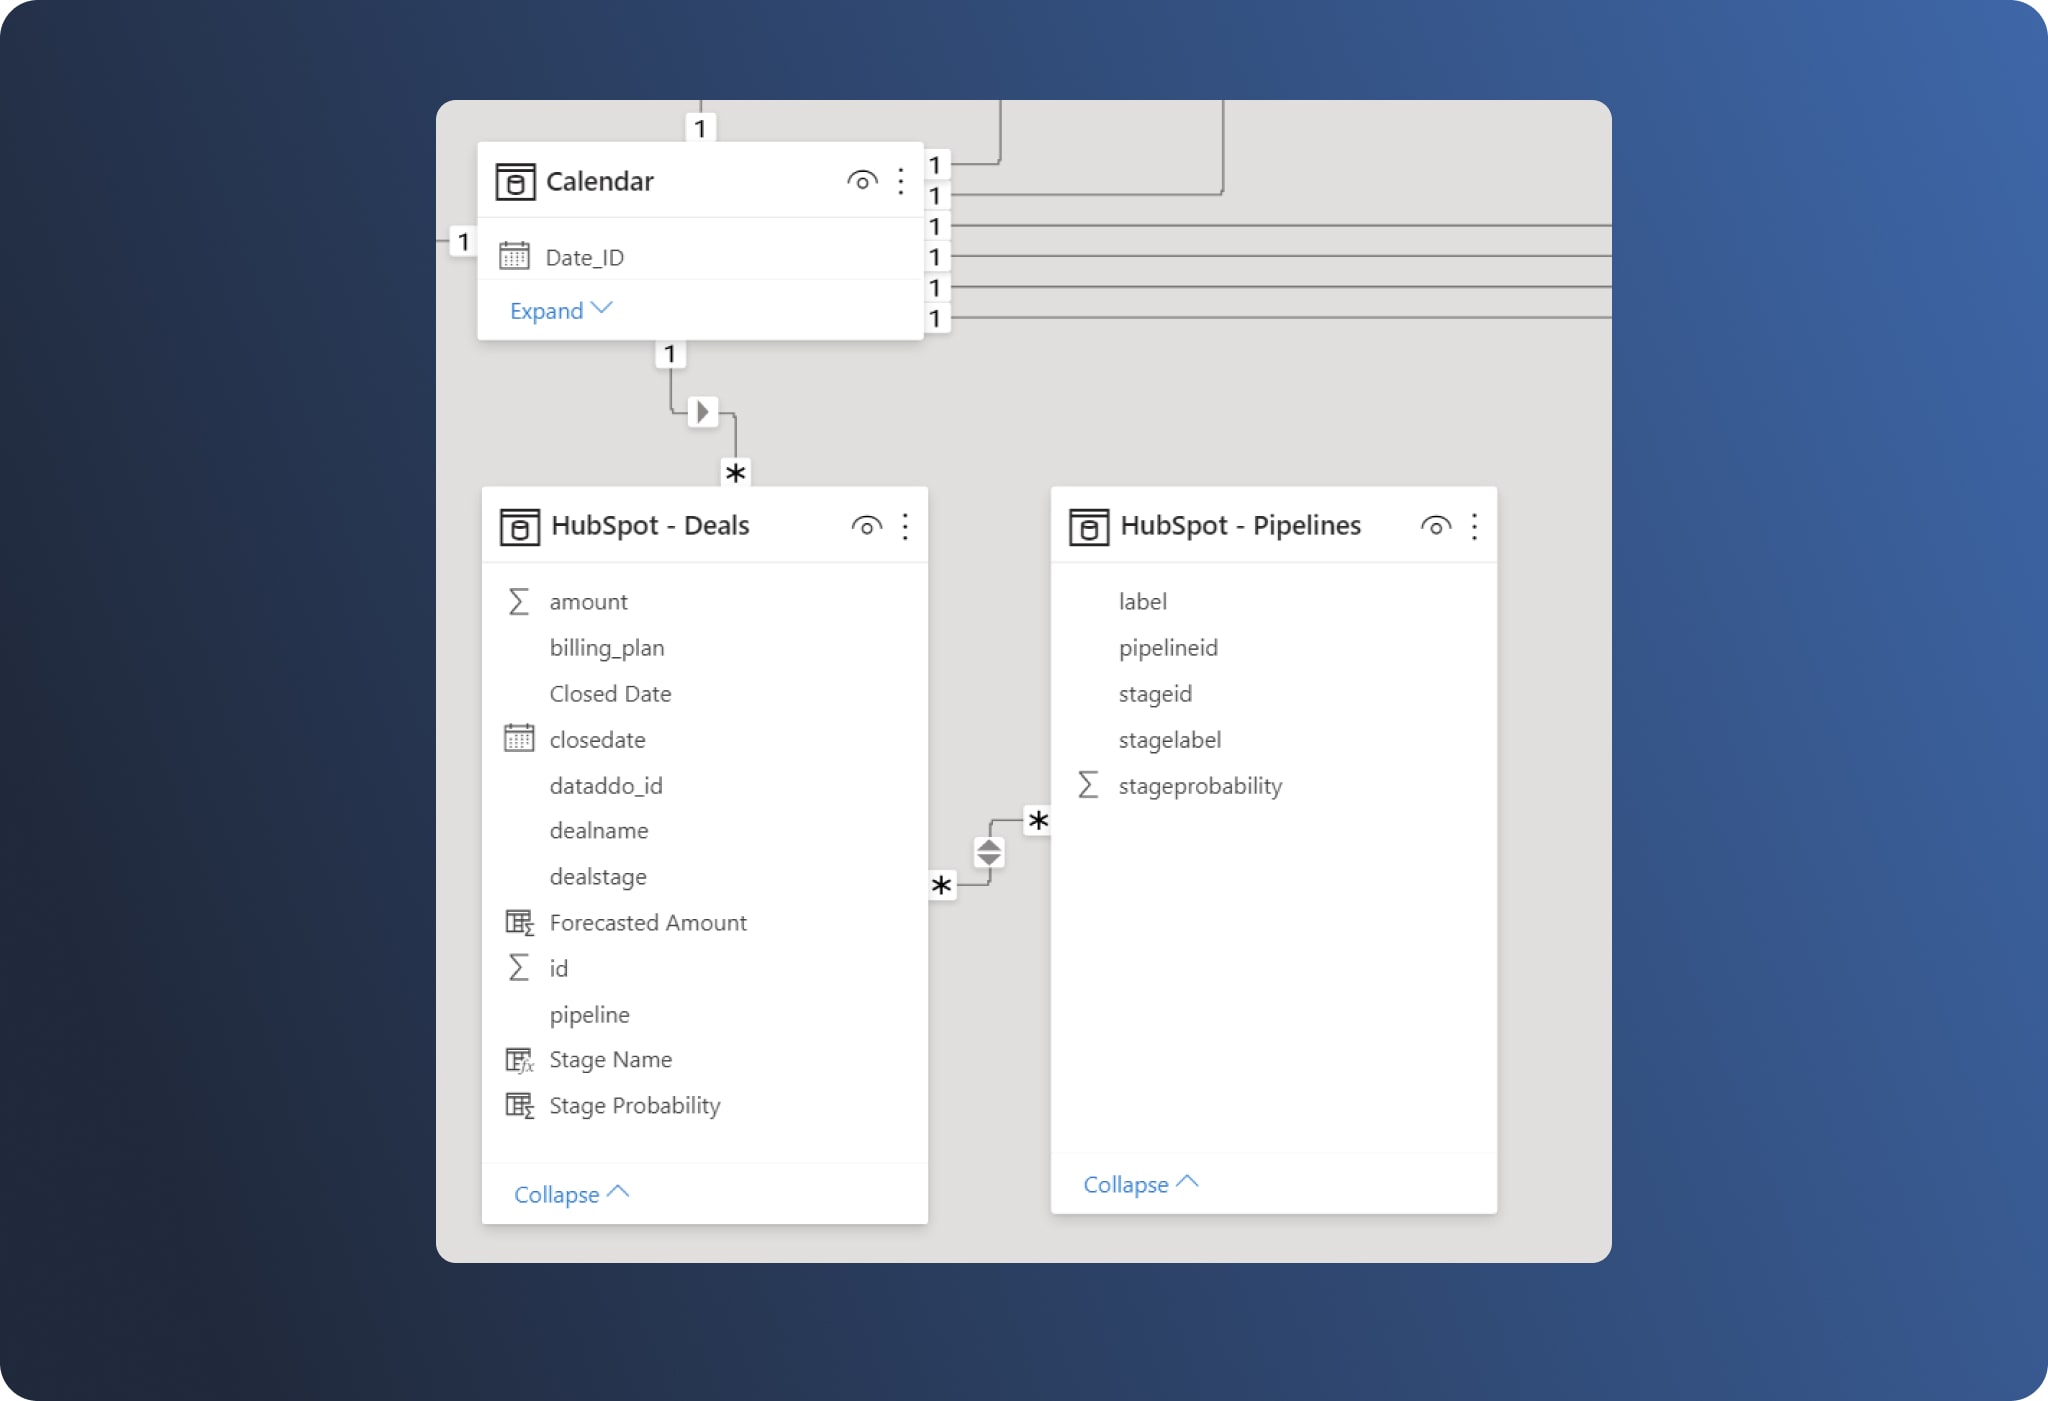
Step 2: You will also need to add “stageprobability” and “stagelabel” from the “Pipelines” table to the “Deals” table. The LOOKUPVALUE function allows you to do that.
Step 3: The last part is to multiply “amount” by “stageprobability” in the “Deals” table. The result is the forecasted amount.
Your Financial Reporting, Upgraded
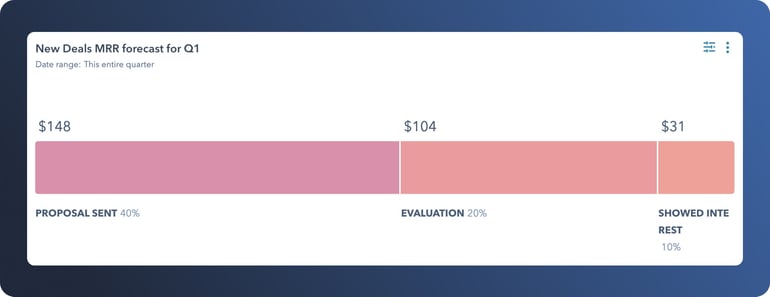
Whereas HubSpot reports leave much to be desired, a PowerBI report can show you complete breakdowns of your Deals and Pipelines data, with vital metrics like probability and expected revenue.
.jpg?width=770&name=bi-min%20(1).jpg)
Remember: the quality of your Power BI data is completely dependent on the quality of your HubSpot data. Be sure to keep your HubSpot deals up to date for the most accurate reporting.
With your HubSpot data now flowing automatically to Power BI, you will have access to updated, synchronized financial forecasts whenever they are needed, without needing to disturb other teams from their tasks.
|
See how Dataddo can help your business Just a few quick steps to get your data to your dashboard for better analysis, without the hassle.
|


Comments