

I’ve been an ecommerce B2C marketer for more than 10 years. Throughout that time, I was reading and learning about B2B techniques and strategies, but never had the opportunity to put them into practice.
Then Dataddo hired me as VP of Marketing to build a marketing strategy for product-led growth, rather than focusing more on a traditional sales approach. If you're building a marketing strategy for a SaaS business, this article breaks down for you our first year with a basic roadmap of what we did and how we built our marketing ecosystem to achieve 5X growth.
Before I dive in, a few caveats:
- I wrote this process month by month to make it easier to follow. In reality, many of these activities were happening simultaneously.
- Not all 5X’s are equal. It’s way easier to achieve 5X growth when you have tens of customers (which, at the time of my starting, we did).
- This has been a collective effort; not just myself, nor the marketing team, but the whole company.
Here’s where we started.
1. January: Audit Your Marketing Presence
2. February: Research Your Customer Base
3. March: Research Competitors to Find Your Market Niche
4. April: Build a Search Advertising Moat
5. May: Take Advantage of Retargeting
6. June: Define Brand Guidelines
7. July: Choose Your Content Focuses
8. August: Invest Your Review Website Presence
9. September: Find Your “North Star” Metric
10. October: Use the Power of Data
11. November: Attend Events that Support Your Brand
January: Audit Your Marketing Presence
If you look at our marketing strategy today, it seems like the obvious approach, but this is just hindsight bias.
My first step when I joined Dataddo was a full marketing audit to gather all the data points I could get my hands on.
There are five tools that I used to look at the data, including legacy data from old accounts and profiles no longer in use:
- Web Archive
- Google Analytics
- Google Search Console
- Advertising Platforms (in our case: Google Ads & Facebook Ads)
- Internal database
I looked at the Web Archive to understand how the website evolved over time, then researched our traffic trends year over year.
We looked at 4 reports: User locations, Traffic Sources, Landing Pages, and Events. We discovered that in the beginning, most traffic was coming from our CEO Petr's own website. The second was traffic from Quora, again for questions answered by the CEO (who was, not coincidentally, basically the only employee at the time). However, that traffic from Quora had stopped 2 years prior.
So, Quora: our first idea for a channel that we wanted to revive.
Next, we looked at Organic landing pages and search queries. From most-visited pages, we built the “category” report for recent data: what group of pages were most visited. Then we went to Google Search queries and filtered by traffic to that category, looking at the search queries for that category. This proved the intent of the user.
Using this approach we found a category of pages that had both higher traffic and higher conversion rates. In other words, these pages were what the user was actually looking for.
This formed the cornerstone of our strategy: building highly-structured search campaigns that drive ready-to-convert traffic.
The pages mentioned above were (and still are) our main landing pages. Rather than redesigning the whole website, we focused our efforts on enhancing these pages.
February: Research Your Customer Base
Every time someone asks me to help them with their marketing, the first thing I always, always say is “understand your audience”. Like most advice, it’s very easy to give but very challenging to follow. We tackled this challenge on a few fronts.
Quantitative data from current customer
Gathering data on your customers is 1) absolutely vital, 2) not as easy as it sounds. Even when you’re using a CRM, customers rarely provide all the information you need (especially if they start using your product as a free trial).
That meant we needed to do some manual work. Using publicly available information (like from LinkedIn) we searched for metrics on both the user and company profiles of current customers.
Pairing this data with their activity in our platform helped us build our first user personas.
Qualitative data from current customers
Quantitative data is alluring (it’s so simple to collect and work with), but without qualitative data, you’ll never have a complete picture.
Originally, we wanted to do this by speaking to our customers directly and asking them to share their opinions (who doesn’t like that??). We crafted emails and sent them to specific customers, asking them to jump on a call with us.
Zero response. A total failure. Lesson learned. Next, we asked our account management team for help, letting them choose the customers and write the emails. We wanted to know: What triggered them to search for a tool like ours? How were they fixing this issue before? What other solutions did they consider/try before buying ours? Why Dataddo?
And guess what? It still didn’t work. Another new approach:
Qualitative data from potential customers: The best thing since sliced bread
Our first two attempts highlighted the problem: no matter how earnest you are about wanting their feedback, not many of your customers will want to speak with you. They have a lot of deadlines. Too many emails. You fall below the lowest item on their priority list.
And if they do agree to speak, you’re still only talking with the ones who decided to buy. You’re not reaching: those who considered you but didn’t buy, and those who don’t even know that you exist.
Our next tactic: not customers, prospects. Using the good relationship we’d built with our Sales team, we asked them to include some specific questions for prospects during their sales calls (how they heard about us, what products they were considering, etc.). And we tasked one of the marketing team to be present on the call to listen and take notes—shout out to Jessica for her brilliant work on this research. Finally, we had something truly effective.
March: Research Competitors to Find Your Market Niche
Without researching the competition, you won’t know your position in the market. Without proper positioning, you’re “just another tool”. You’re not giving your potential customer a reason to choose (or even consider) your product.
Product research
Since we were (of course), using Dataddo to integrate our own marketing data, we decided to use each one of our competitors' products to do the same thing and compare them accordingly. We were paying attention to:
- Signup process
- Email communication
- Support
- Ease of use
- Data quality
- Pricing strategy
Marketing activities research
You can also snoop around their marketing activities. There are a few amazing tools that you can use for this like Semrush or Sprout Social.
But we took the manual approach yet again, looking at:
- Website copy and visuals
- Ads (Search, Facebook Ads “link to how to do it”)
- Social posts
- Blog and other content materials
April: Build a Search Advertising Moat
Disclaimer: No, we didn't actually wait 4 months to build and launch our Search Advertising campaigns. I wouldn’t have kept my position that long.
Users don’t search for solutions, they search for problems. Hotjar potential customers are more likely to search for terms such as “how to improve conversion rate” rather than “session recording software”.
Looking at the most visited category of pages from the initial marketing audit, we identified the main features that were solving our customers' problems. Coming from the eCommerce world, I started thinking of them as a list of products.
We used the Single-Keyword-Ad-Group approach (SKAG). That means a lot, A LOT, of work initially that eventually pays off (eventually). Yes, Google keeps pushing for more automated approaches, but based on my own experiments, the algorithm isn’t up to snuff yet.
You might end up with a few thousand campaigns. But as the Pareto Principle goes, you will find that 20% (or even less) of your campaigns bring you the majority of your conversions. Focus your time on these.
May: Take Advantage of Retargeting
Do not make the mistake (which I frequently do) of neglecting retargeting opportunities. Remember, if you achieve more than a 5% conversion rate: congratulations, you’re a world-class marketer. But, 95% of your website visitors, many of which you paid for, are lost.
But they don’t have to be. Most likely, a large portion of this traffic falls into your target group, they just weren’t convinced to convert. We all need a bit of convincing sometimes, don’t we?
We used Google Display Network as well as social media channels to retarget our non-converting visitors, using three different ad formats -
- Products they visited: showing them the same products they viewed on our website.
- Case Studies: social proof of other brands using our platform that achieved similar goals.
- Blog Posts: to establish our brand as a thought leader.
June: Define Brand Guidelines
As your team grows, so does your need for defined brand guidelines, as multiple people are writing materials representing the company.
Petr Nemeth, our CEO, insisted that the whole company get involved in conceiving these guidelines. The people are the company, and they should have a voice. And they did.
We created a Google form survey and asked everyone to cast their votes, sharing opinions on what our values should be and what communication with our customers should sound like.
After heated discussions and repeated brainstorming sessions, we came up with a defined list of brand guidelines and tone of voice, making tweaks in our communication to reflect it.
July: Choose Your Content Focuses
When tackling our content, we knew better than to throw all of our eggs in one basket with one type of content. But FOUR baskets were just diversified enough that we knew we could do it, and do it well.
Case Studies
We decided to hit two three four birds with one stone by focusing effort on case studies:
- We can speak with customers directly and enhance our qualitative research.
- Our team got more knowledgeable of our product by studying use cases.
- Given that case studies are bottom-of-funnel content, we linked to them in our landing pages to provide social proof and increase conversion rates.
- They help convince on-the-fence customers in our retargeting ads.
Newsletters
Newsletters are brilliant — not only do they keep your customers engaged and informed on your product and give you immediate feedback, but they do the same for your team.
We needed to make sure that our users (or at least some of them) will open these newsletters regularly. Otherwise, it’s a waste of time. We focused on a few key elements:
- Send the newsletter only once a month.
- Work on meaningful, yet catchy subject lines.
- Separate it into consistent sections: product updates, blog posts, a news corner, etc.
Bottom of the funnel SEO content
SEO can be even more competitive than paid search and take longer to mature, but there are always opportunities to grab. For lack of proper competition (read: better content), many low-quality and outdated articles are ranking high for keywords and would be easily usurped.
We focused on long-tail keywords, keywords we were already targeting with paid ads, and keywords with a low search volume that would still be solved by our product. Content should be useful, after all.
By internally linking to our landing pages, these content pieces help us convert users who would benefit from our solution, but didn’t click on the ads.
Educational content: Digging into our gold mine
Educational content is what ultimately helps to position your brand as a “thought leader.” This year, we have only taken baby steps in our educational content. We started by interviewing our CEO and people from the tech team, which generated initial content ideas.
The gold mine was our prospects' words. We dug into all those notes we are taking from attending the sales calls. These are actual challenges actual users want our platform to solve. We then built a list of topic ideas to address these challenges (don’t forget the long-tail keywords) and generated content accordingly.
August: Invest in Your Review Website Presence
We think that we make our decisions rationally and that our customers do the same. In most cases, we make emotional decisions and then rationalize them. Yes, even in B2B.
Capitalizing on herd behavior is one way to reach your customers’ emotional side, and this is where review websites come in — the ultimate in social proof. Focus on one review website and encourage all your customers to add reviews there. For the rest, make sure you always have an updated profile.
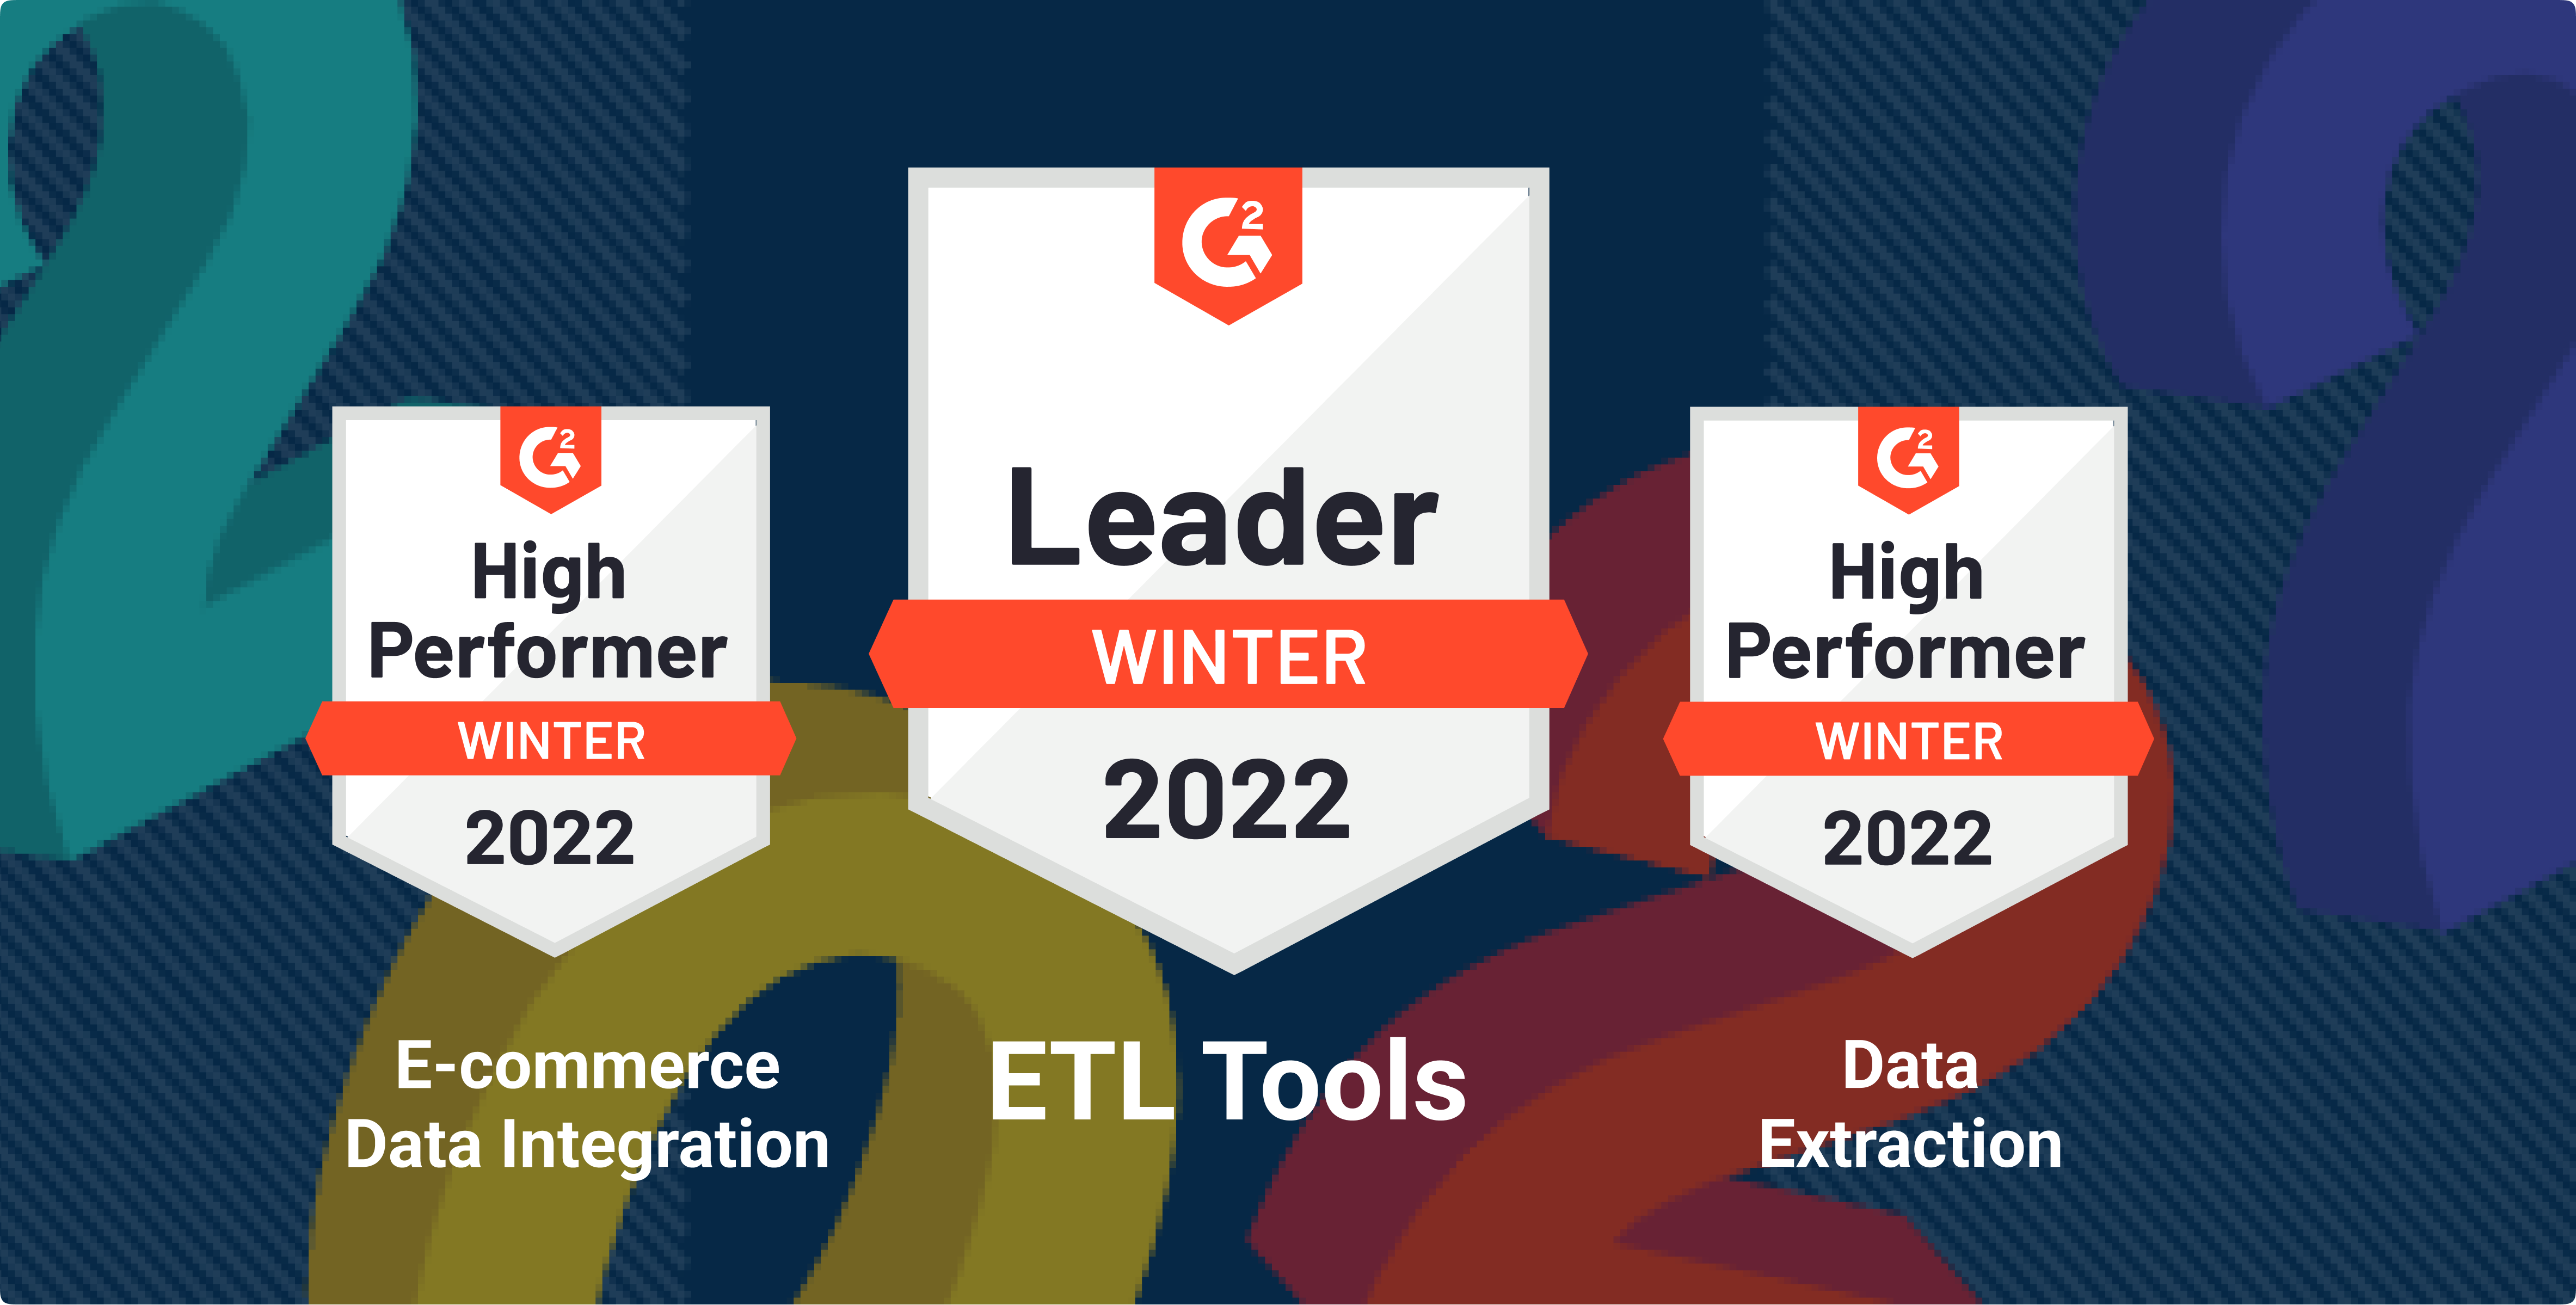
For reference, Dataddo has focused on G2, but we also have a presence on Capterra.
Investing time in your review website presence gets you:
- (Kind of) Organic conversions: Some users go to these websites directly to look for new tools. Plus, these websites usually invest in organic and paid search to rank for listings keywords.
- External Social Proof: Rather than the logos and case studies you picked for your website, reviews give customers an external source to prove your worth.
- Recognition (badges): I told you we are such emotional beings, and who doesn’t love a medal? Some of the review websites provide badges for best-performing tools that you can put on your homepage (not to brag, but Dataddo has a few).
- Paid options: Some review websites let you rank higher using the PPC approach, while others use only organic ranking, but you can pay to receive “buyer intent data.” This gives you a glimpse of which users are currently in-market for a product like yours. We are investing in both approaches.
September: Find Your "North Star" Metric
As a marketer in a SaaS business, your goal is largely to bring leads. High-quality leads.
How do you define high-quality in a quantitive way?
We identified three crucial steps a trialist needs to take in our application in order to see the full potential of the platform. We started calling users who made it through them all as having “full platform experience”.
Looking at the numbers, we found out that users with “full platform experience” have three times the conversion rate of those without it. That’s it. That’s the metric. That’s our north star. This is our users’ Aha Moment.
Again, in hindsight, this looks VERY obvious. But until you do the work, it’s not obvious at all. Now, this is the weekly number by which we measure the success of our marketing activities business.
October: Use the Power of Data
Once you reach a certain level of growth, having a proper data infrastructure is inevitable. Luckily for us, we get to use Dataddo. Here are some highlights:
Tracking micro conversions
Between signup and subscription, there are many events that predict the possibility of a user becoming a paying customer. We track these micro conversions and send them back to our advertising platforms.
Tracking events directly from our backend
You cannot depend solely on front-end data if you need accuracy, especially for events like subscriptions. We were already using MongoDB, and since Dataddo has a connector for MongoDB, we took advantage and connected MongoDB to our BigQuery account.
Getting data from our payment gateway
Becoming a customer is not the end of the user journey; upsells and downsells are also necessary for tracking revenue. Using the Dataddo connector for Stripe, we extracted the data, sent it to BigQuery, and paired it with the rest of the customer details using their billing ID.
Getting data from advertising platforms
Once you get revenue data, you need cost data to calculate your ROI. We extracted data from all of our advertising tools, plus Google Analytics, and sent it to BigQuery. There, it’s paired with user actions using the user ID, excluding personally identifiable info.
Transform data and send it to Power BI
Time to close the cycle. Using BigQuery’s transformation capabilities, we paired data tables, removed duplicates, cleaned traffic sources from Google Analytics, and build a model for revenue attribution.
From there, we built our reports in Power BI for everyone to access and have a clear understanding of our performance.
Enable self-serve reporting for all teams
Our product, sales, and finance teams are heavily data-driven—not only the marketing team.
While our data is centralized, we have a decentralized (or liberal) approach to the usage of that data. The Dataddo platform gives us the ability to send data to multiple destinations. So, while the marketing team uses mainly Power BI, other teams send their relevant data to other tools such as Google Data Studio, allowing them to access their reporting numbers at any time, as needed.
November: Attend Events that Support Your Brand
And I’m also talking about offline events, this time.
Attending events can be difficult because it’s not easy to fit them into the model above to measure their effectiveness. But that doesn’t diminish their importance.
We started by focusing on key markets that we want to strengthen our position in and finding the most relevant events there—data festivals, panel discussions, even webinars where we can represent Dataddo. There are popular events we know about and many more that fly under the radar, but which can be equally effective.
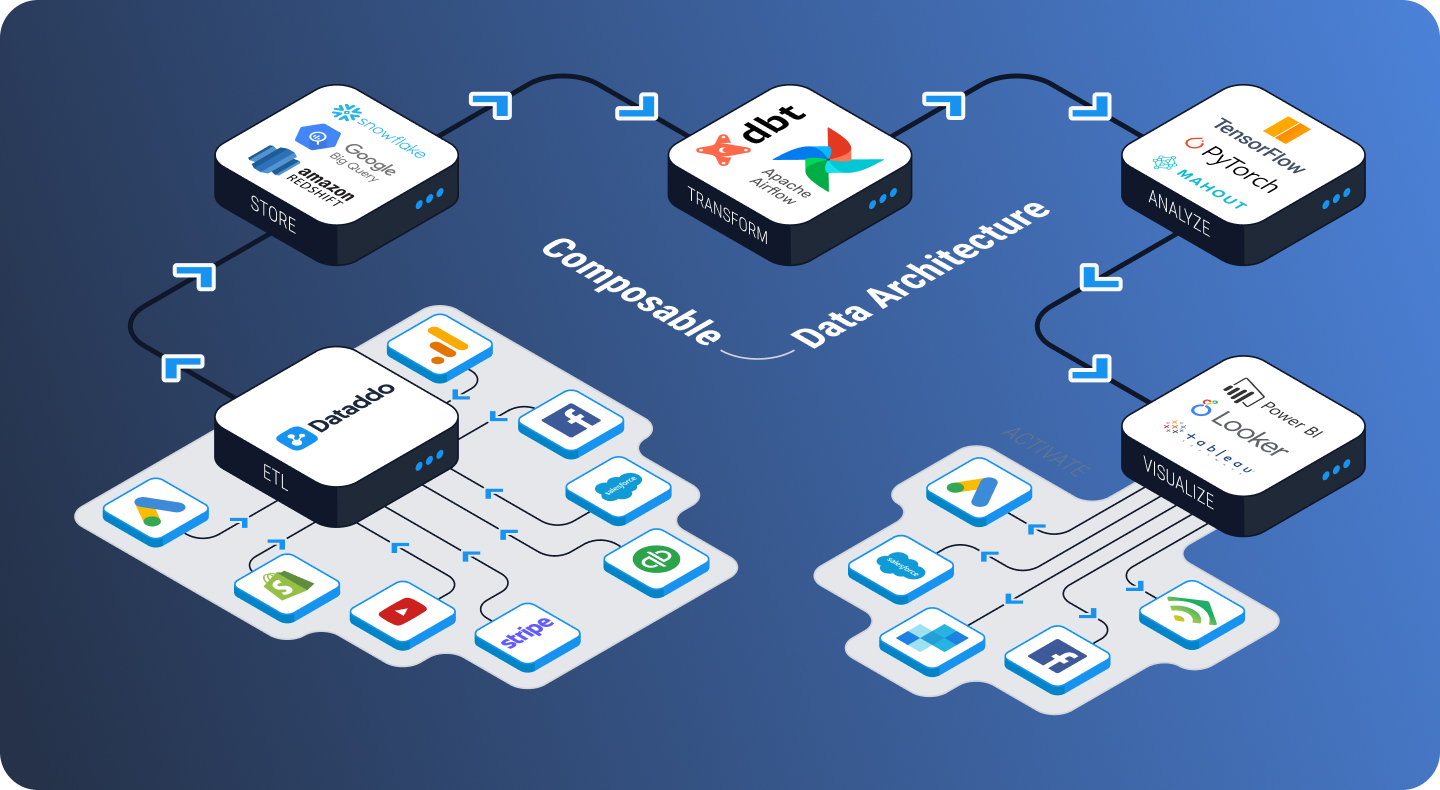
Events can improve your brand awareness, bring you leads, and ignite partnerships. That’s why we are managing this activity in cooperation with both the sales team and the partnerships teams, making a conscious effort to promote our brand visions (like the importance of building a composable data architecture).
December: Grow Your Team
Current Talent

One thing that we set in stone early on is the importance of growing our expertise individually. And by stone I mean calendar.
We need to expand our knowledge of our own product, the industry, and marketing in general. Besides attending sales calls, company-wide tech talks, and weekly meetings with our head of Solutions, every team member is required to allocate a minimum of 4 hours per week (booked in their calendar) for personal growth. These are spent reading articles or watching videos, which we discuss during our own weekly marketing meetings.
Acquiring new talent
The most important asset a business has is its human resources, and we have been extremely lucky with our early hires. One approach that we keep implementing is hiring good talents even if we don’t have open positions for them at the moment. We know such talents will not be available tomorrow when we need them.
However, we still need more and more people and we are just starting. If you want to join our journey check our open positions here.
Takeaways
That’s it. That’s Dataddo’s first year of focused marketing. If you remember nothing else:
- Some of your best data is under your nose - don’t forget to research your own customers for qualitative and quantitative data.
- Experiment with paid ad approaches, and invest a lot of time in the early stages for better results later.
- Finding your market position will help guide your overall strategy.
- Diversify the types of content you produce.
- Identify your “north star” metric and keep it in mind with everything you do.
Good luck.
|
See how Dataddo can help your business Just a few quick steps to get your data to your dashboard for better analysis, without the hassle.
|


Comments